ORCL Stock Technicals Today: Gains 3.06%, Momentum Weakens
On Oktober 5, 2026: price 142.30 USD, trend sideways, RSI 48.4, support 132.60, resistance 162.52. technical analysis of orcl stock. ORCL Stock Technicals —…

Oracle is holding above its recent lows, but the chart still says the burden of proof sits with the bulls: the shares closed at 142.30 USD, below both the short- and medium-term trend gauges, while momentum remains mixed and volume has not yet delivered a decisive turn.
Trend & Price Action
The stock’s latest move — up 3.06% on the day and 3.79% over 5 days — looks constructive at first glance, especially after a softer 1 month decline of 7.62%. But the bigger signal is not the bounce itself; it is where the bounce happened. Oracle is still trading below the SMA20 at 145.98 and below the SMA50 at 143.59, which means the price has not yet reclaimed the short-term trend line or the intermediate trend line. That matters because these moving averages act like a market memory: when price stays under them, rallies often get treated as recovery attempts rather than confirmed trend reversals.
The broader setup remains sideways, with the SMA20 slope at -1.78% over 5 days. A falling short-term average tells readers the recent path of least resistance has still been downward, even if the stock is no longer in free fall. The lack of a fresh MA-cross also suggests the market has not produced a clean trend signal yet.
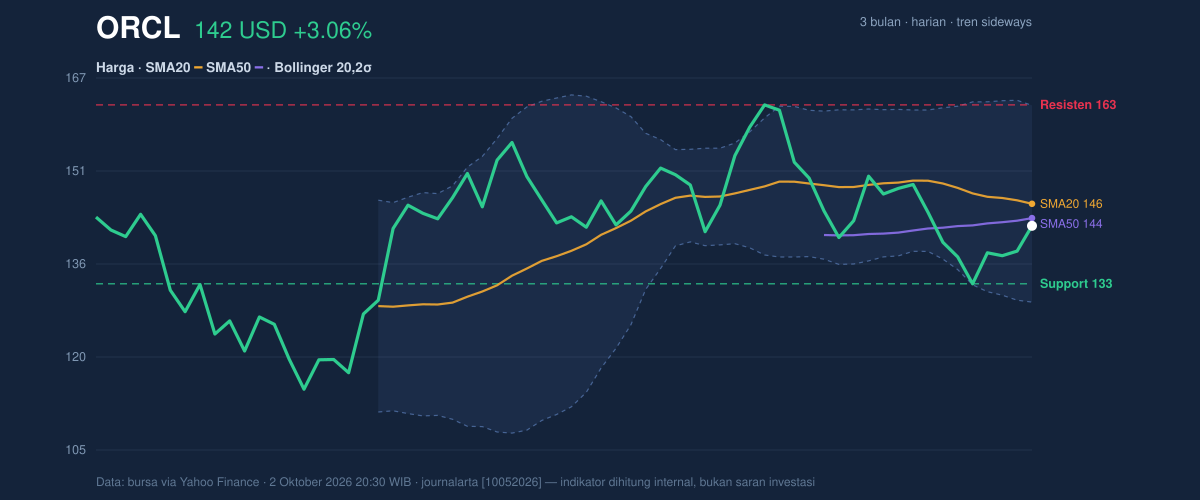
Oracle is sitting in the lower half of its recent range, with price at 32% of the 20-hour range between support at 132.60 and resistance at 162.52. That positioning is important: it means the stock is not near breakdown territory, but it is also nowhere near proving that sellers have fully exhausted themselves.
Oscillators & Momentum
Momentum indicators are telling a more cautious story than the day’s price gain. The RSI at 48.4 is neutral, which means the stock is neither overbought nor oversold. In plain English, RSI is a speed gauge for price pressure; at this level, it is saying Oracle has room to move either way, but no strong momentum edge has emerged. The Stochastic reading of %K 48.7 and %D 31.6 is also neutral, though the gap between the two lines hints that short-term momentum has improved from a weaker base. Still, this is not the kind of alignment that usually accompanies a powerful breakout.
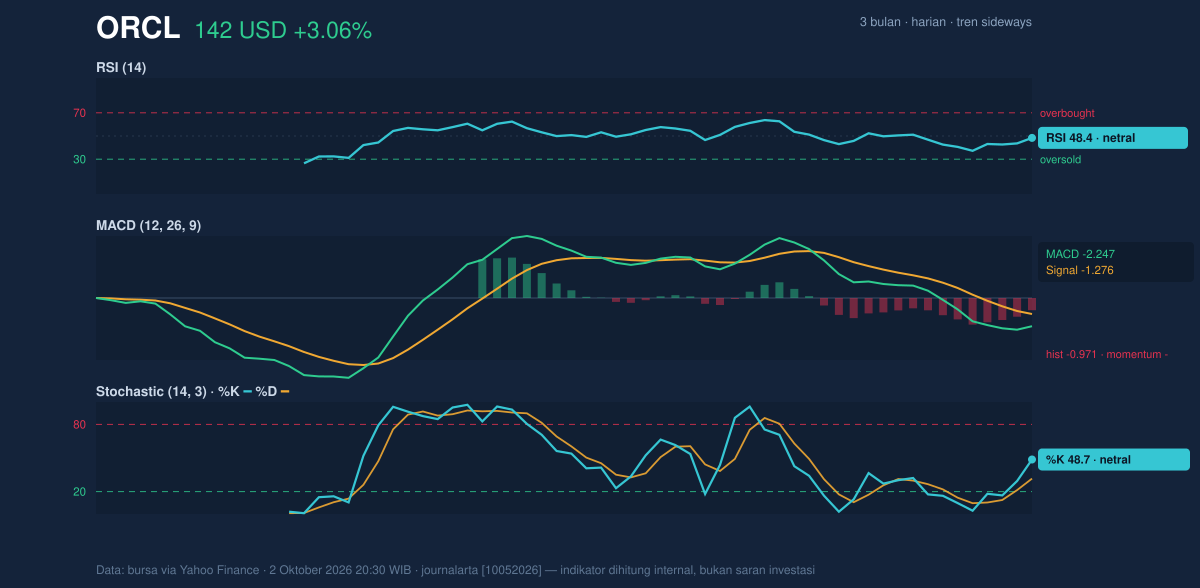
The more decisive signal is from MACD. Oracle’s MACD at -2.247, below the signal line at -1.276, with a histogram of -0.971, shows momentum remains negative. MACD is designed to capture trend acceleration; when it stays below its signal line, it suggests the recovery has not yet overwhelmed the prior downshift in price behavior. So while the stock is bouncing, the momentum structure has not fully turned.
That is the key tension in the chart.
Volatility & Volume
Volatility is elevated. The ATR(14) at 6.34, equal to 4.5% of price, shows Oracle is capable of moving meaningfully in either direction in a short period. ATR, or average true range, is not a direction signal; it is a measure of how much the stock tends to move. Here, it says traders should expect wider daily swings than in a quieter tape.
The Bollinger Bands reinforce that point. Price is trading below the middle band at 145.98, with the upper band at 162.42 and lower band at 129.54. The %B at 39% means the stock is below the midpoint of the band structure, closer to the lower half than the upper half. More importantly, the bands have a 22.5% width and are expanding, which usually signals a volatility phase rather than a calm consolidation. Expanded bands often come before stronger directional moves — but not always in the direction bulls want.
Volume does not yet validate a bullish shift. Last volume was 35,330,300, almost exactly in line with the 20-hour average of 36,279,495, or 1.0× normal. That means the move higher did not arrive with a surge in participation. The OBV is falling, which is a warning sign because on-balance volume tracks whether money flow is accumulating or leaving. A rising price with falling OBV often implies the bounce has not yet won broad sponsorship.
The message from the tape is simple: the stock is active, but not yet convincingly supported.
Key Levels & Scenarios
The first level that matters is support at 132.60. If Oracle loses that area, the chart would likely shift from range-bound weakness toward a more vulnerable structure. On the upside, resistance at 162.52 is the ceiling that would need to be cleared to show the recent rebound has real follow-through. Between those markers sits the moving-average cluster: SMA20 at 145.98 and SMA50 at 143.59. Reclaiming that zone would improve the technical tone because it would put price back above the trend references that currently cap it.
The 3-month high at 170.70 and 3-month low at 114.50 frame the larger battleground. Oracle is far from the lows, but still well below the highs, which fits the picture of a stock in correction mode rather than a confirmed new advance.
Technical Verdict: HOLD (wait & see)
HOLD (wait & see) because the chart is not broken, but it is not repaired either.
- Reason 1: Price remains below SMA20 and SMA50, and the SMA20 slope is negative, which keeps the short-term trend soft.
- Reason 2: MACD is negative and below its signal line, showing momentum has not fully flipped back in favor of buyers.
- Reason 3: Volume is only 1.0× normal and OBV is falling, so the rebound lacks strong participation.
- Verdict invalidated if price breaks below 132.60, because that would put the stock through the nearest support and weaken the current range structure.
- Ideal Entry Range: 143.59 to 145.98
- Exit Target: 162.42 to 162.52
- Stop Loss protection: below 132.60
In plain English: Oracle is trying to stabilize, but the chart still needs proof that this bounce is more than a pause. “It’s better than panic, but it’s not yet a clean turn.”
Summary Data ORCL
| Last price | 142.30 USD |
| Change 1 day / 5 days / 1 month | 3.06% / 3.79% / -7.62% |
| Trend / MA-cross | sideways / none |
| SMA20 / SMA50 | 145.98 / 143.59 |
| RSI (14) / Stochastic %K | 48.4 / 48.7 |
| Bollinger %B / ATR | 39% / 6.34 |
| Support / Resistance 20 days | 132.60 / 162.52 |
| Data as of | 2 Oktober 2026 20:30 WIB |
Track ORCL stock price daily: live levels, support/resistance and our full ORCL analysis history.