BP Stock Gains 0.29%, Testing Key Resistance In Focus
On October 12, 2026: price 588.00 GBp, trend uptrend, RSI 65.7, support 542.30, resistance 588.00. technical analysis of bp stock. BP Stock Gains — full…
Trend & Price Action
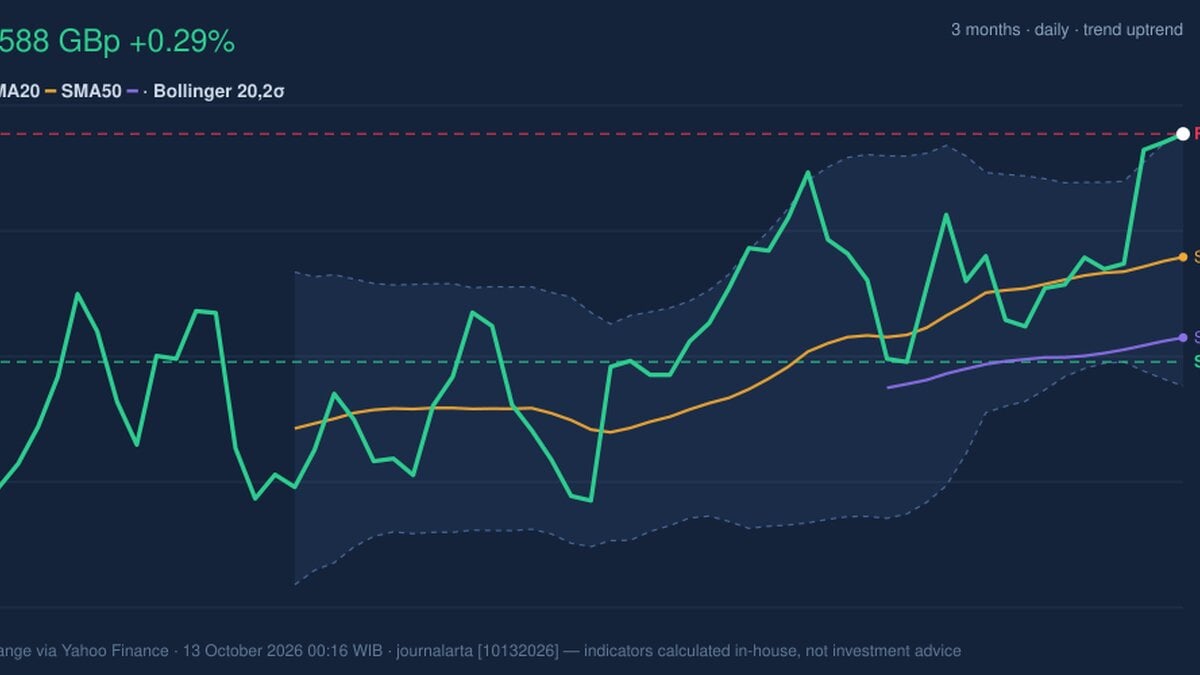
BP’s share price is above both its 20-day simple moving average (SMA), at 563.31 GBp, and its 50-day SMA, at 547.17 GBp. A moving average smooths price fluctuations to show the prevailing direction; the shorter-term average sitting above the longer one, alongside a rising 20-day slope, is consistent with an uptrend. There has been no new crossover, however, so the advance is not accompanied by a fresh moving-average signal. The price is now at the stated 20-day resistance of 588.00 GBp and at the upper end of its reported three-month range. The resistance is significant because it marks a point where recent buyers may take profits or sellers may emerge. A sustained move beyond it would signal that demand is absorbing that supply; a rejection would leave the moving averages and lower support as reference points. As shown in the chart, the price is close to the upper Bollinger Band, which tracks price movement around a moving average. Its 98% position within the band indicates that shares are near the top of their recent range, not that a reversal is certain. The band width is normal rather than narrowing, so the data do not show a volatility squeeze that might precede a sharp breakout.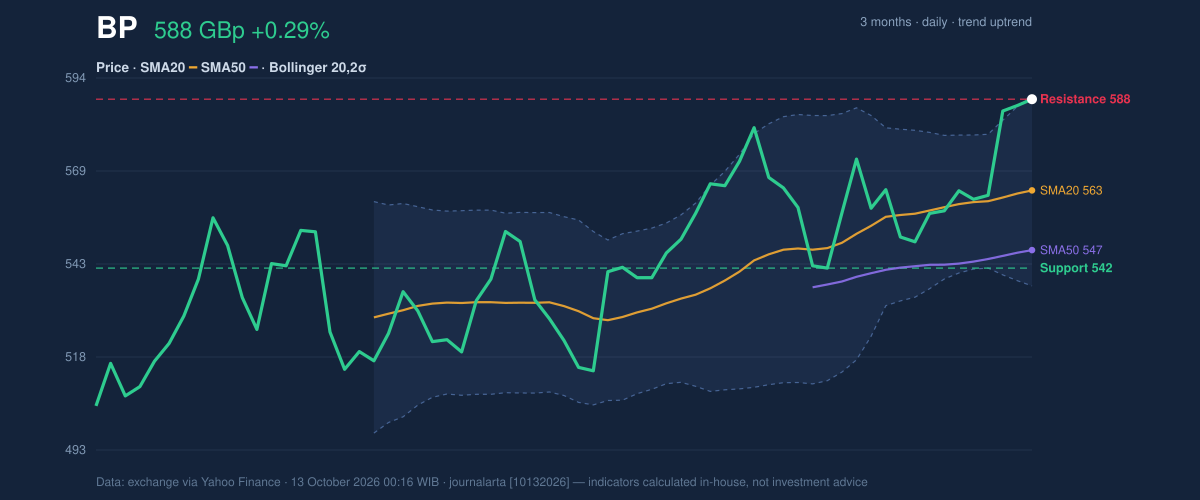
Oscillators & Momentum
Momentum indicators are positive but not fully aligned. The RSI, or Relative Strength Index, is 65.7 and classified as neutral: it reflects strong recent gains without reaching the usual overbought threshold. By contrast, the Stochastic reading is overbought, with %K at 100.0 and %D at 99.0. This indicator compares the latest close with prices over a recent period; near-maximum readings can mean the rally is extended, although they do not by themselves establish that a decline has begun. The MACD is positive: its reading of 8.688 is above the 6.267 signal line, and its histogram is positive at 2.421. MACD compares shorter- and longer-term price averages to gauge momentum. Here it confirms the upward direction, while the Stochastic warns that the pace could be difficult to sustain without consolidation.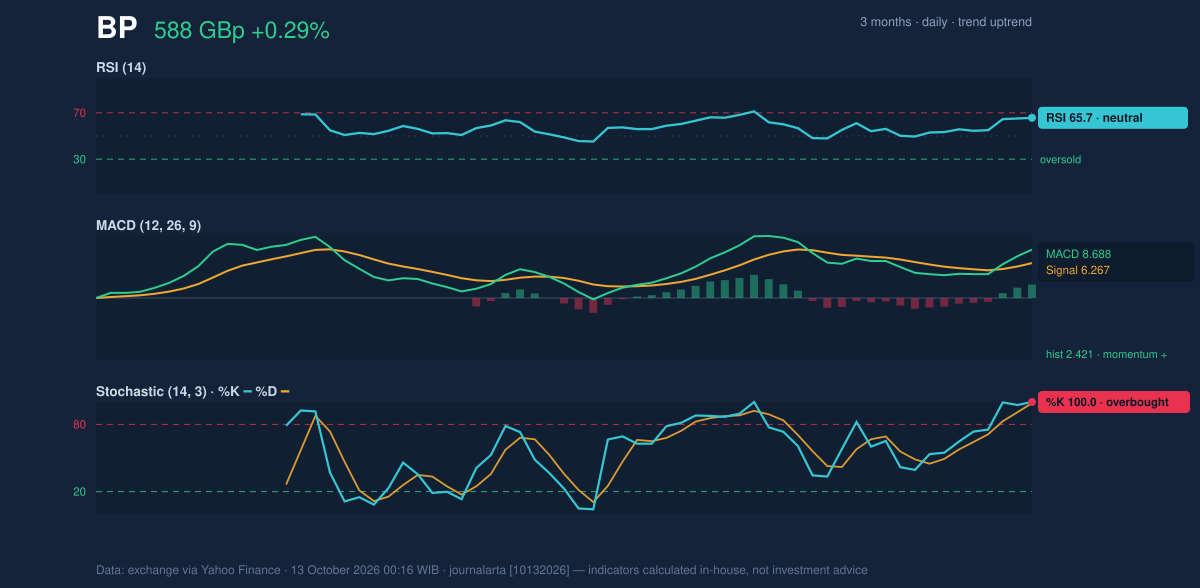
Volatility, Volume & Key Levels
Average True Range (ATR), a measure of typical price movement, is 56.25 GBp, equal to 9.6% of the share price. That points to high volatility: moves can be substantial relative to the current price, increasing the risk of abrupt swings. The latest volume reading is recorded as 160, against a 20-day average of 42,808,697, and is classified as thin. That makes the day’s price move difficult to treat as strong confirmation from trading participation, even though On-Balance Volume (OBV), which tracks cumulative volume pressure, is rising. The immediate levels are 588.00 GBp resistance and 542.30 GBp support, based on the 20-day data. A break above resistance would extend the current price structure; failure to hold and a move below support would weaken it. The 20-day SMA at 563.31 GBp is an intermediate reference, while the lower Bollinger Band at 537.46 GBp marks a wider downside boundary in the current volatility framework. The supplied three-month low is 0.00, so it does not provide a useful practical support level.Technical Verdict: HOLD (wait & see)
The indicators lean upward, but the price is already at resistance and the Stochastic is overbought. Thin reported volume also limits confidence that the latest move has broad participation. Together, those signals support a wait-and-see reading rather than treating the breakout as established. - Ideal entry range: 563.31–588.00 GBp, bounded by the 20-day SMA and current resistance. - Exit target: 588.00 GBp, the stated resistance level. - Stop-loss protection: 542.30 GBp, the stated 20-day support. - Invalidation: The verdict is invalidated if the price falls below 542.30 GBp. For non-traders, the trend is rising, but the shares are at a ceiling and short-term momentum looks stretched. Technical analysis only; this is not an investment recommendation.Data table
Why BP is in focus today
- Closed at a 20-day high (588.00)
- Trading near its 3-month high (588.00)
- Uptrend confirmed (5-day change 4.40%)
Selected automatically from 16 LSE (UK) stocks by a technical-signal score with daily weighted randomisation — not a recommendation.
| Measure | BP.L |
|---|---|
| Last price | 588.00 GBp |
| Daily change | 0.29% |
| Five-day change | 4.40% |
| One-month change | 2.94% |
| SMA20 / SMA50 | 563.31 / 547.17 GBp |
| RSI(14) | 65.7, neutral |
| Stochastic %K / %D | 100.0 / 99.0, overbought |
| MACD / signal / histogram | 8.688 / 6.267 / 2.421 |
| ATR(14) | 56.25 GBp; 9.6% of price |
| Support / resistance | 542.30 / 588.00 GBp |
Summary Data BP
| Last price | 588.00 GBp |
| Change 1 day / 5 days / 1 month | 0.29% / 4.40% / 2.94% |
| Trend / MA-cross | uptrend / none |
| SMA20 / SMA50 | 563.31 / 547.17 |
| RSI (14) / Stochastic %K | 65.7 / 100.0 |
| Bollinger %B / ATR | 98% / 56.25 |
| Support / Resistance 20 days | 542.30 / 588.00 |
| Data as of | 13 October 2026 00:16 WIB |
Disclaimer: This technical analysis is generated automatically from exchange data (via Yahoo Finance) and indicators calculated by JournalArta, for information and education only. The verdict and the entry, target and stop-loss levels are not investment advice or a solicitation to buy or sell any security. Investment decisions and their risks rest solely with the reader.
Track BP share price daily: live levels, support/resistance and our full BP analysis history.