HSBC Stock Technicals: Gains 2.34% on Monday, Momentum Weakens
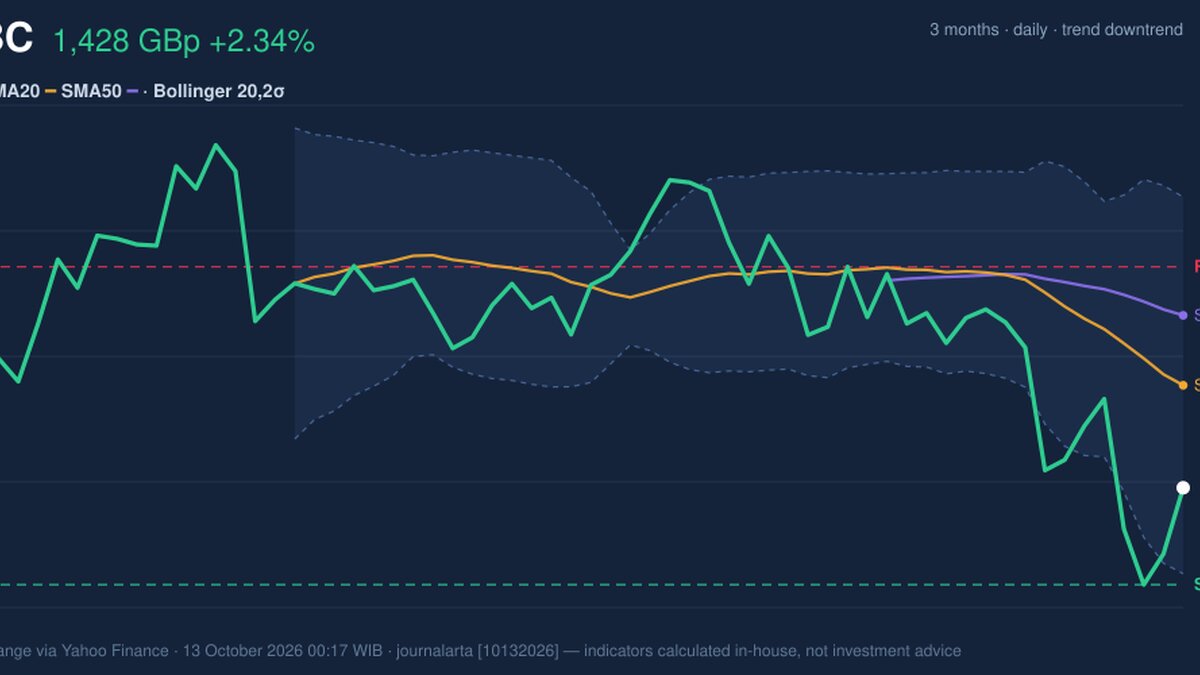
On October 12, 2026: price 1,428.40 GBp, trend downtrend, RSI 41.0, support 1,380.60, resistance 1,537.40. technical analysis of hsbc stock.
Why HSBC is in focus today
- Downtrend extending (5-day change -2.10%)
Selected automatically from 16 LSE (UK) stocks by a technical-signal score with daily weighted randomisation — not a recommendation.
Trend & Price Action
HSBC trades below its 20-day simple moving average (SMA) of 1,478.93 GBp and its 50-day SMA of 1,513.44 GBp. A simple moving average smooths recent prices; when the share price sits below both, it suggests sellers have had the upper hand across short- and medium-term periods. The 20-day average is also sloping down, by 2.17% over five days. There has been no new moving-average crossover, so the data offer no signal that the trend has turned. The shares are near the lower part of their 20-trading-day range, at 30% of the distance between support at 1,380.60 GBp and resistance at 1,537.40 GBp. The lower Bollinger Band—an indicator that tracks price movement around an average—stands at 1,385.99 GBp, close to that support. The price is at 23% of the band’s range, meaning it is nearer the lower boundary than the upper one, but not by itself proof of a rebound.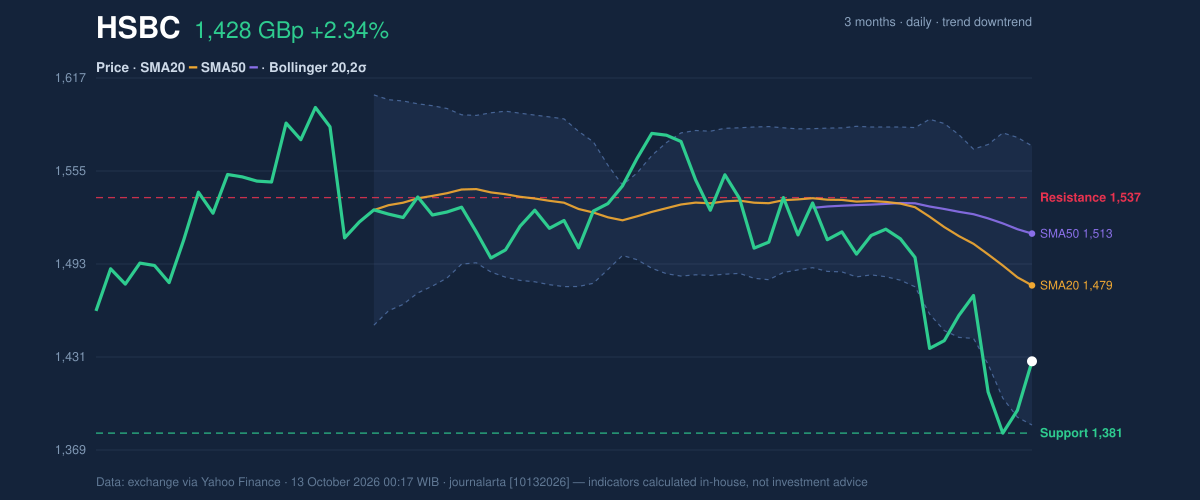
Oscillators & Momentum
Momentum indicators are mixed, with the more trend-sensitive signal still negative. The MACD is below its signal line, with a negative histogram; that combination points to downward momentum rather than a confirmed recovery. The Relative Strength Index, or RSI, is 41.0, a neutral reading that does not show the shares as deeply oversold. The stochastic oscillator sends a more volatile signal: %K at 92.9 is in overbought territory, while %D is 38.7. The gap between the two can reflect a sharp near-term bounce, but it does not outweigh the falling trend and negative MACD. It also means the day’s advance may be vulnerable if buyers do not follow through.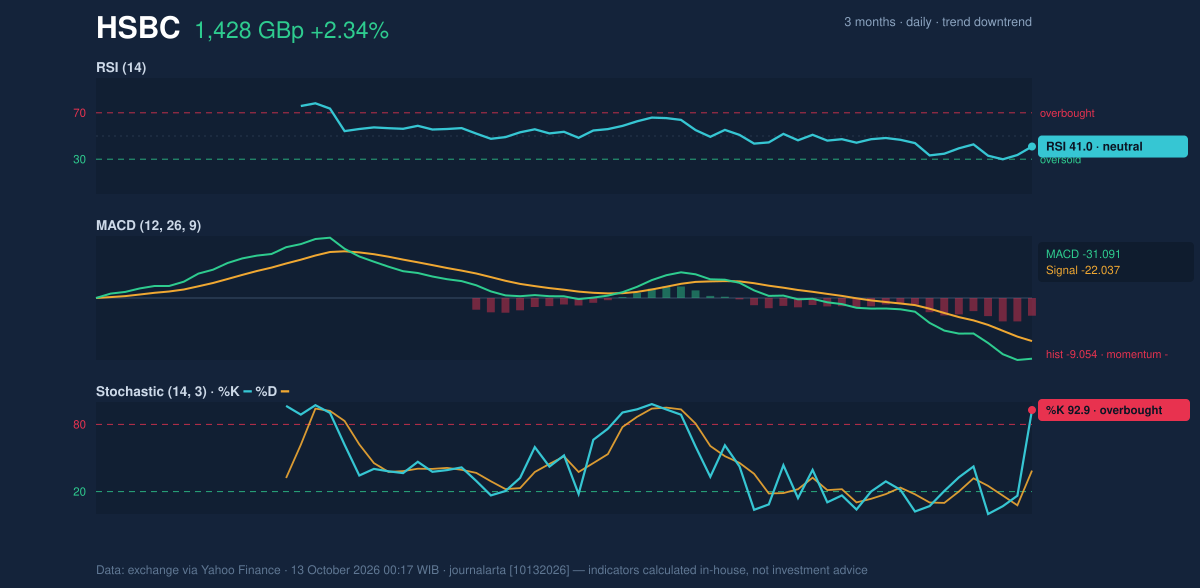
Volatility & Volume
The average true range (ATR), a measure of typical price movement, is 132.00 GBp, or 9.2% of the share price—a high level of volatility. That makes technical levels less precise as boundaries: movements can be sizeable even without a decisive break in direction. Bollinger Band width is 12.6%, described as normal, so the data do not point to an unusually tight market setup poised for an outsized move. Trading participation provides little confirmation for the rebound. The reported latest volume is 0.0× the 20-day average, classified as thin, while on-balance volume (OBV)—a running measure of whether volume tends to accompany rising or falling prices—is declining. Together, those readings weaken the case that the one-day gain reflects broad buying pressure.Key Levels & Scenarios
The first test is 1,380.60 GBp, the 20-trading-day support, close to the lower Bollinger Band. A sustained move below that area would weaken the near-term structure further. If support holds, the next important hurdle is 1,478.93 GBp, the 20-day average; above it, resistance at 1,537.40 GBp becomes the next reference point. A move toward those levels would need stronger volume and improving momentum to indicate more than a short-lived bounce.Technical Verdict: SELL
The technical picture leans bearish: the share price is below declining short-term and medium-term averages; MACD remains negative; and OBV is falling. The oversold-versus-overbought picture is not uniform—RSI is neutral and stochastic %K is elevated—so the case rests chiefly on trend and participation rather than a single oscillator. - Ideal Entry Range: 1,478.93–1,537.40 GBp, using the 20-day average and resistance as reference levels. - Exit Target: 1,380.60 GBp, the 20-trading-day support. - Stop Loss: 1,571.87 GBp, the upper Bollinger Band. - Invalidation: This verdict is invalidated if price breaks above 1,537.40 GBp. For non-traders, the indicators show that HSBC’s recent rise has not yet displaced the prevailing downward trend.| Metric | Reading |
|---|---|
| Last price | 1,428.40 GBp |
| 20-day / 50-day SMA | 1,478.93 / 1,513.44 GBp |
| RSI / MACD | 41.0 / -31.091 |
| 20-day support / resistance | 1,380.60 / 1,537.40 GBp |
| ATR (14) | 132.00 GBp |
Summary Data HSBC
| Last price | 1,428.40 GBp |
| Change 1 day / 5 days / 1 month | 2.34% / -2.10% / -7.05% |
| Trend / MA-cross | downtrend / none |
| SMA20 / SMA50 | 1,478.93 / 1,513.44 |
| RSI (14) / Stochastic %K | 41.0 / 92.9 |
| Bollinger %B / ATR | 23% / 132.00 |
| Support / Resistance 20 days | 1,380.60 / 1,537.40 |
| Data as of | 13 October 2026 00:17 WIB |
Disclaimer: This technical analysis is generated automatically from exchange data (via Yahoo Finance) and indicators calculated by JournalArta, for information and education only. The verdict and the entry, target and stop-loss levels are not investment advice or a solicitation to buy or sell any security. Investment decisions and their risks rest solely with the reader.
Track HSBC share price daily: live levels, support/resistance and our full HSBC analysis history.