ICBC Stock Analysis: Drops 1.36%, Momentum Weakens
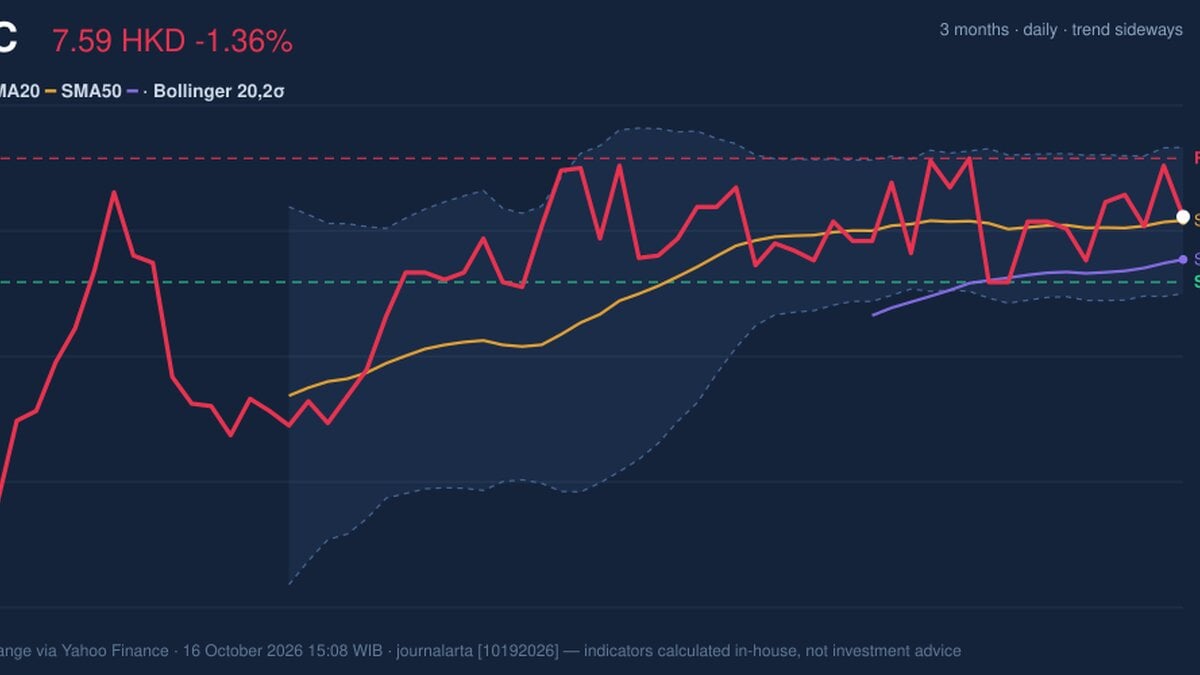
On October 16, 2026: price 7.59 HKD, trend sideways, RSI 51.6, support 7.45, resistance 7.71. technical analysis of icbc stock. ICBC Stock Analysis — full…
Trend & Price Action
At HK$7.59, the stock is just above its SMA20 at HK$7.58 and SMA50 at HK$7.50. The 20-day average has edged up 0.20% over five trading days, but there has been no fresh moving-average crossover. In plain terms, the short-term trend has a slight upward tilt, while the absence of a new crossover offers little confirmation of a sustained move. The share sits at 53% of its 20-trading-day range, between support at HK$7.45 and resistance at HK$7.71. That middle-of-range position leaves neither side with a clear technical advantage. The three-month high and low are HK$7.77 and HK$6.81, respectively; the latest price remains within that wider band. As shown in the chart, the Bollinger Bands — a measure of how far price is moving around its recent average — are narrowing around the share. The bands span HK$7.43 to HK$7.73, with price close to the midpoint at HK$7.58. Their 4.0% width signals a squeeze: price movement has become relatively contained, which can precede a larger move, but does not by itself indicate its direction. The squeeze is a watchpoint, not a breakout signal.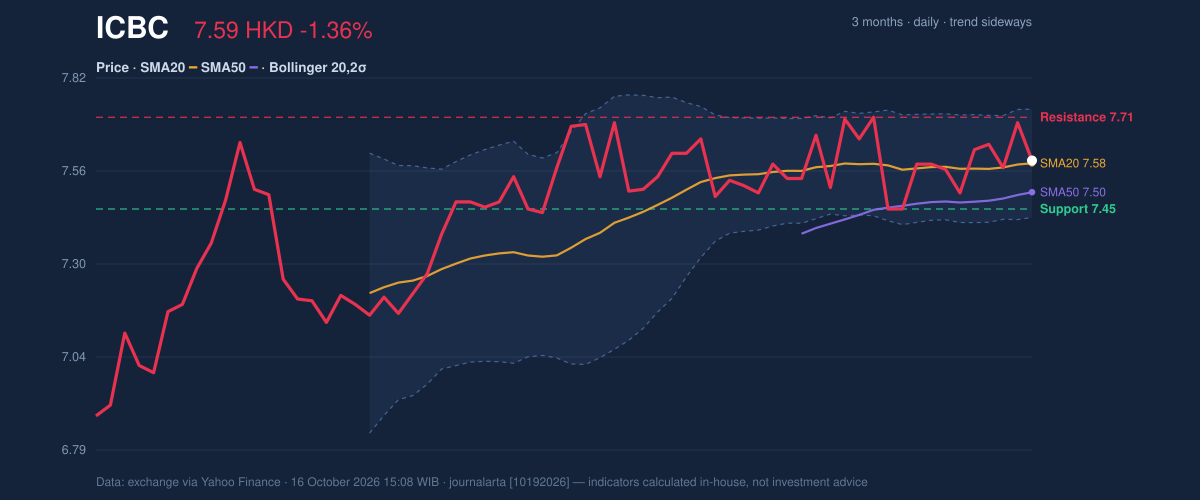
Oscillators & Momentum
The momentum readings are mixed but mostly neutral. The RSI is 51.6, a neutral reading, meaning recent gains and losses are broadly balanced rather than showing an unusually stretched move. Stochastic %K at 50.7 and %D at 58.4 are also neutral; %K below %D is consistent with some loss of short-term momentum, but does not establish a reversal. The MACD provides the clearest near-term warning. Its value is 0.028, just below the 0.029 signal line, while the histogram has turned slightly negative at -0.001. The gap is small, so it points to softening momentum rather than a confirmed downward trend. The indicator matters because the share’s otherwise stable price structure is not being matched by improving momentum.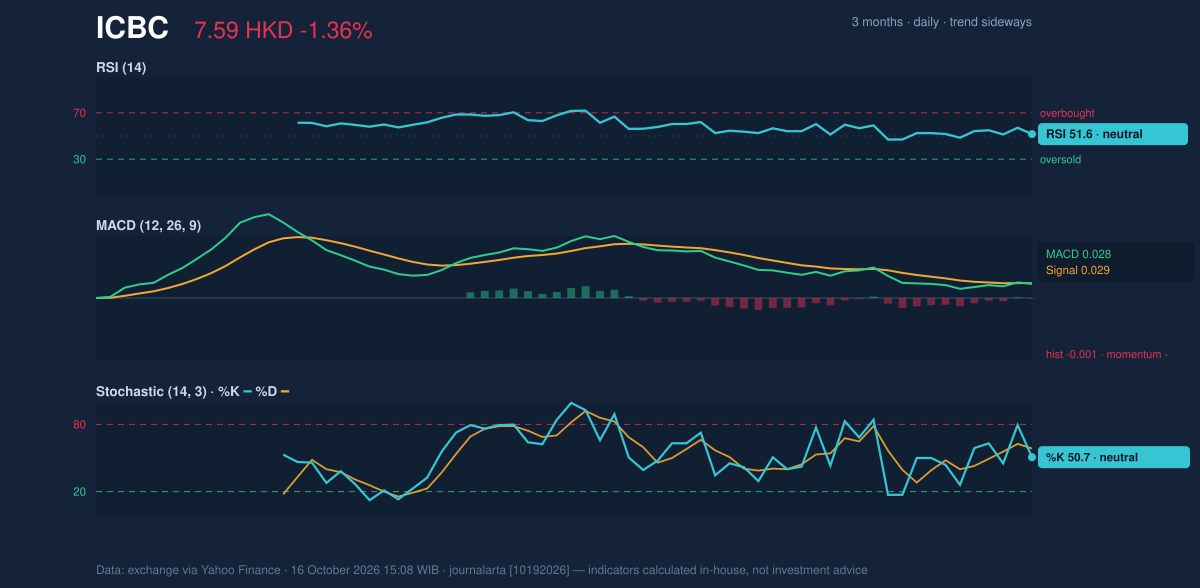
Volatility, Volume & Key Levels
Average True Range, which measures typical daily price movement, is HK$0.16, or 2.1% of the share price. That indicates moderate volatility. Against this backdrop, the 4.0% Bollinger width suggests recent trading has been comparatively compressed, even though the latest session saw heavier participation. Volume reached 208.1 million shares, above the 155.0 million 20-day average. But On-Balance Volume (OBV), a running measure of whether volume is associated with net buying or selling, is falling. Higher turnover alongside declining OBV weakens the case that buyers are accumulating the shares. The combination may reflect increased activity during the pullback, rather than broad confirmation of the preceding five-day gain. The immediate test is whether price can hold the support zone around HK$7.45 while the MACD remains marginally negative. A break above HK$7.71 would put the upper end of the recent range in focus; failure to hold HK$7.45 would weaken the short-term structure and expose the lower end of the Bollinger band at HK$7.43. For now, the balance of evidence favors a range-bound reading with momentum fading at the margin.Technical Verdict: HOLD (wait & see)
The technical verdict is HOLD (wait & see), based on three signals: the sideways trend and lack of a fresh MA crossover, neutral RSI and Stochastic readings, and the MACD histogram’s move below zero. The squeeze in Bollinger Bands raises the chance of an expansion in movement, while declining OBV gives limited confirmation to the elevated volume. - Ideal Entry Range: HK$7.45–HK$7.58, using 20-trading-day support and the SMA20 as reference levels. - Exit Target (Target Price): HK$7.71, the 20-trading-day resistance. - Stop Loss protection: HK$7.43, the lower Bollinger Band. - Invalidation: This verdict is invalidated if price breaks below HK$7.43. For non-traders, the signals are mixed: the shares remain in a range, but momentum has softened and a clearer move has yet to emerge.Data: HKEX data via Yahoo Finance, as of Oct. 16, 2026, 15:08 WIB. Technical analysis is not an investment recommendation.
Why ICBC is in focus today
- MACD histogram has just turned negative
Selected automatically from 16 HKEX (Hong Kong) stocks by a technical-signal score with daily weighted randomisation — not a recommendation.
Summary Data ICBC
| Last price | 7.59 HKD |
| Change 1 day / 5 days / 1 month | -1.36% / 1.20% / 0.93% |
| Trend / MA-cross | sideways / none |
| SMA20 / SMA50 | 7.58 / 7.50 |
| RSI (14) / Stochastic %K | 51.6 / 50.7 |
| Bollinger %B / ATR | 53% / 0.16 |
| Support / Resistance 20 days | 7.45 / 7.71 |
| Data as of | 16 October 2026 15:08 WIB |
Disclaimer: This technical analysis is generated automatically from exchange data (via Yahoo Finance) and indicators calculated by JournalArta, for information and education only. The verdict and the entry, target and stop-loss levels are not investment advice or a solicitation to buy or sell any security. Investment decisions and their risks rest solely with the reader.
Track ICBC share price daily: live levels, support/resistance and our full ICBC analysis history.