AMZN Stock Analysis: Gains 4.98%, Testing Key Resistance
On October 19, 2026: price 262.45 USD, trend sideways, RSI 57.3, support 246.15, resistance 262.45. technical analysis of amzn stock. AMZN Stock Analysis —…
Trend & Price Action
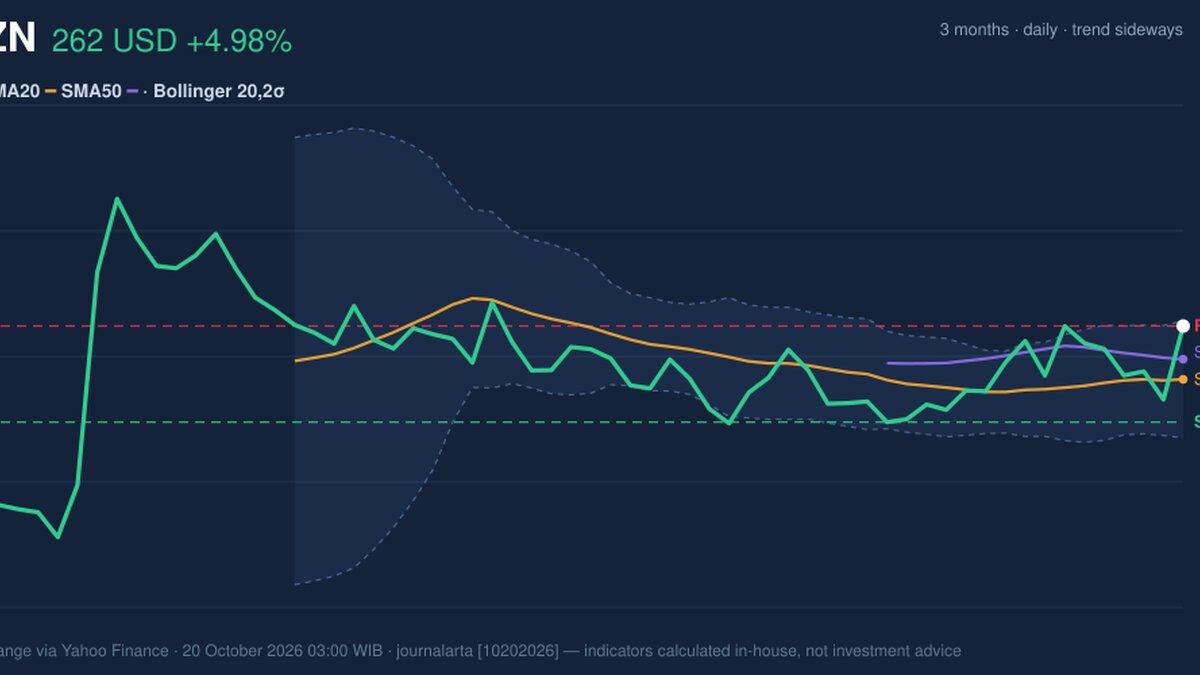
Amazon’s broader pattern remains sideways, despite the sharp daily gain. The stock is above its SMA20 at $253.43, and that average has a modest upward slope of 0.44% over five days. But the price is below the SMA50 at $256.84? No: at $262.45 it is above both averages. The gap above the SMA50 is therefore a constructive near-term signal, although there has been no new moving-average crossover to confirm a broader trend change. The stock is at 100% of its 20-session range, with resistance at $262.45—the same as the last price. That places the next test immediately overhead. The three-month high of $287.20 provides wider context, but the supplied data does not make it an immediate resistance level. A squeeze in the Bollinger Bands, whose width is 7.8%, points to contracting recent volatility and the potential for a larger move; it does not determine the direction.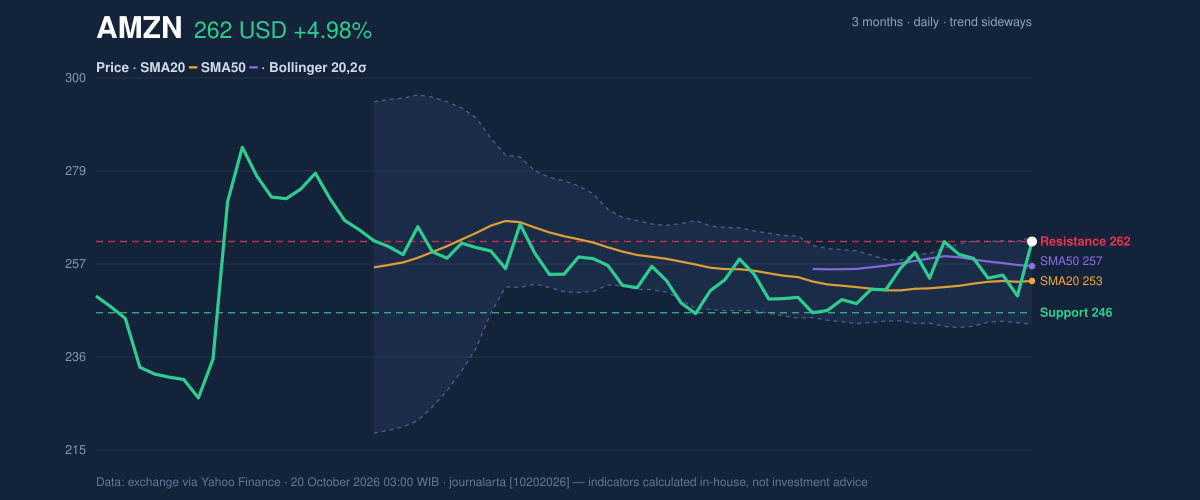
Oscillators & Momentum
MACD is positive: its reading is 0.777 against a signal line of 0.166, with a positive histogram of 0.611. This indicates that recent upward momentum is strengthening relative to the signal line. RSI at 57.3 is neutral, so it does not yet show an extreme condition that would independently confirm either a sharp extension or a reversal. The caution comes from Stochastic %K at 92.8, above %D at 57.3. That overbought reading suggests the latest rise has been rapid compared with the stock’s recent price range. It can persist during a strong advance, but it raises the risk that momentum cools if price cannot clear resistance. The indicators therefore support a positive short-term impulse, not an unqualified trend reversal.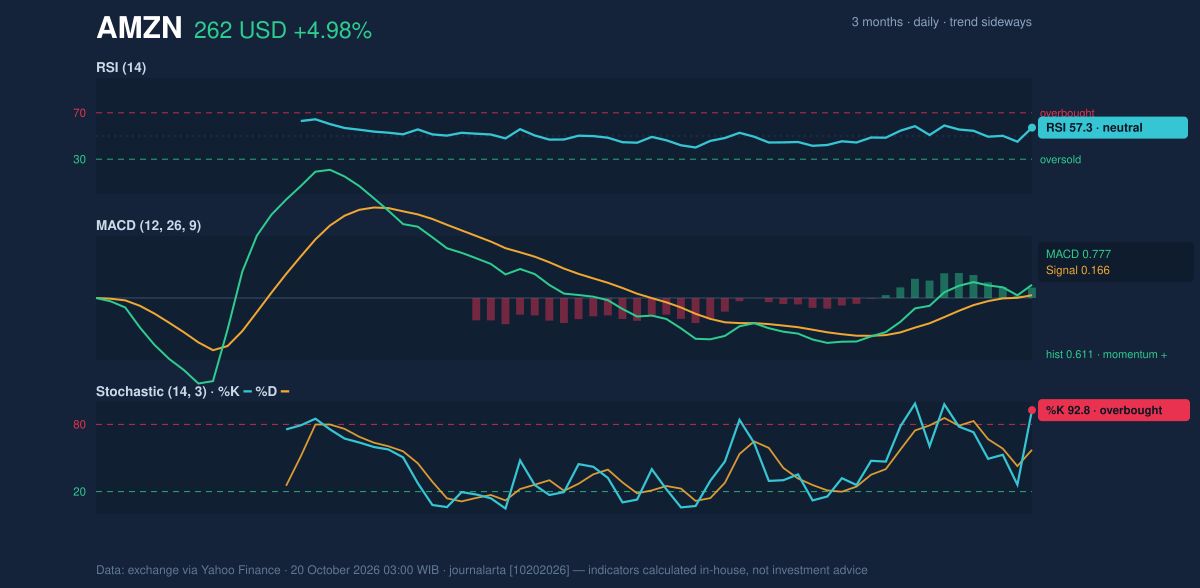
Volatility, Volume & Key Levels
Volume reached 56,068,100 shares, compared with a 20-session average of 36,460,585, while OBV was rising. OBV, or On-Balance Volume, uses price direction alongside volume to track whether trading activity is broadly accumulating or distributing shares. Its rise alongside above-average turnover supports the view that the advance drew stronger participation, rather than occurring on thin trading. At 95% of the Bollinger range, Amazon is close to the upper band at $263.35. The band is not a hard ceiling, but the proximity underscores how extended the price is within that measure. ATR of $6.62, or 2.5% of price, indicates moderate day-to-day volatility; after a move around twice that range, fluctuations may remain significant. The nearest levels are $262.45 resistance and $246.15 support, both defined over 20 sessions. A sustained move above resistance would indicate that buyers have overcome the immediate range ceiling; failure to hold support would weaken the constructive reading. Between those levels, the $253.43 SMA20 and $256.84 SMA50 are reference points for whether the breakout attempt retains support from trend averages.Technical Verdict: HOLD (wait & see)
The indicators lean positive, but the price is already at the stated resistance and the Stochastic reading is overbought. The verdict is HOLD (wait & see) on the technical evidence: MACD is positive, volume is above average with OBV rising, and price is above both moving averages, but the sideways trend and resistance cap confirmation. The verdict is invalidated if price falls below $246.15 support. - Ideal Entry Range: $253.43–$256.84, using the SMA20 and SMA50 as reference levels. - Exit Target (Target Price): $263.35, the upper Bollinger Band; this is a technical reference, not a forecast. - Stop Loss protection: $246.15, the stated 20-session support level. For non-traders, the chart signals improving demand, but the price is testing resistance before a lasting move is confirmed.Data table — AMZN, as of Oct. 20, 2026, 03:00 WIB; source: exchange data via Yahoo Finance.
Why AMZN is in focus today
- One-day move of 4.98%, about 2.0× its average daily range (ATR)
- Volume at 1.5× the 20-day average
Selected automatically from 32 NASDAQ (US) stocks by a technical-signal score with daily weighted randomisation — not a recommendation.
| Indicator | Reading |
|---|---|
| Last price | $262.45 |
| Daily / five-day / one-month change | +4.98% / +1.13% / +1.55% |
| SMA20 / SMA50 | $253.43 / $256.84 |
| Bollinger upper / middle / lower | $263.35 / $253.43 / $243.50 |
| Bollinger %B / width | 95% / 7.8% |
| RSI(14) | 57.3 |
| Stochastic %K / %D | 92.8 / 57.3 |
| MACD / signal / histogram | 0.777 / 0.166 / 0.611 |
| ATR(14) | $6.62 (2.5%) |
| Volume / 20-session average | 56,068,100 / 36,460,585 |
| 20-session support / resistance | $246.15 / $262.45 |
| Three-month high / low | $287.20 / $226.16 |
Summary Data AMZN
| Last price | 262.45 USD |
| Change 1 day / 5 days / 1 month | 4.98% / 1.13% / 1.55% |
| Trend / MA-cross | sideways / none |
| SMA20 / SMA50 | 253.43 / 256.84 |
| RSI (14) / Stochastic %K | 57.3 / 92.8 |
| Bollinger %B / ATR | 95% / 6.62 |
| Support / Resistance 20 days | 246.15 / 262.45 |
| Data as of | 20 October 2026 03:00 WIB |
Disclaimer: This technical analysis is generated automatically from exchange data (via Yahoo Finance) and indicators calculated by JournalArta, for information and education only. The verdict and the entry, target and stop-loss levels are not investment advice or a solicitation to buy or sell any security. Investment decisions and their risks rest solely with the reader.
Track AMZN stock price daily: live levels, support/resistance and our full AMZN analysis history.