CAT Stock Analysis: Drops 0.68%, RSI Oversold
On October 19, 2026: price 725.79 USD, trend downtrend, RSI 29.9, support 725.79, resistance 863.44. technical analysis of cat stock. CAT Stock Analysis — full…
Why CAT is in focus today
- RSI(14) at 29.9 — oversold zone
- Downtrend extending (5-day change -9.20%)
Selected automatically from 30 NYSE (US) stocks by a technical-signal score with daily weighted randomisation — not a recommendation.
Trend & Price Action
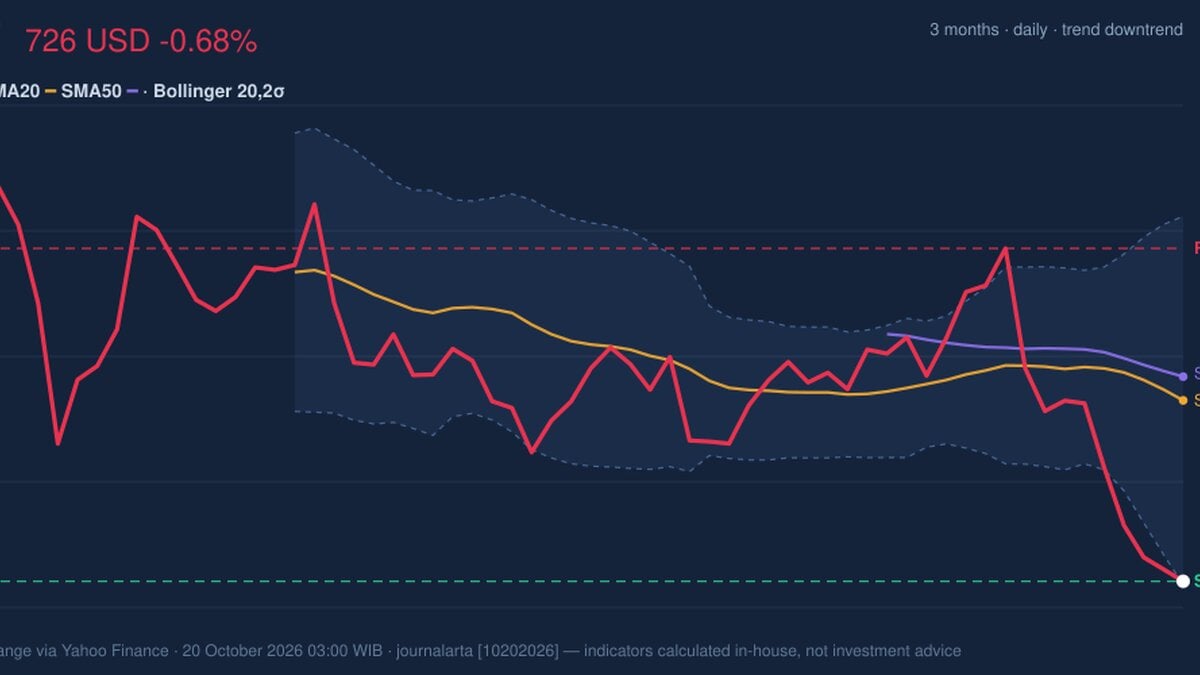
Caterpillar’s last price is below both its 20-day simple moving average, at $800.57, and its 50-day average, at $810.43. The 20-day average is sloping downward, reinforcing rather than contradicting the falling price. There has been no recent crossover between the averages, so the chart offers no new signal that the broader direction has turned. The shares have lost 11.11% over one month and are at the bottom of the 20-trading-day range. They are also not far above the three-month low of $704.01, while the three-month high stands at $935.00. The gap between the current price and the moving averages shows how far the recent decline has pulled the stock below its short- and medium-term trend markers. As shown in the chart, the lower Bollinger Band is at $724.39, just below the last price. Bollinger Bands track price movement around a moving average; touching the lower band can indicate unusually weak trading, but it is not proof that a floor has formed. The bands are at normal width, not unusually compressed, so the data do not suggest a period of exceptionally quiet trading before a likely sharp breakout.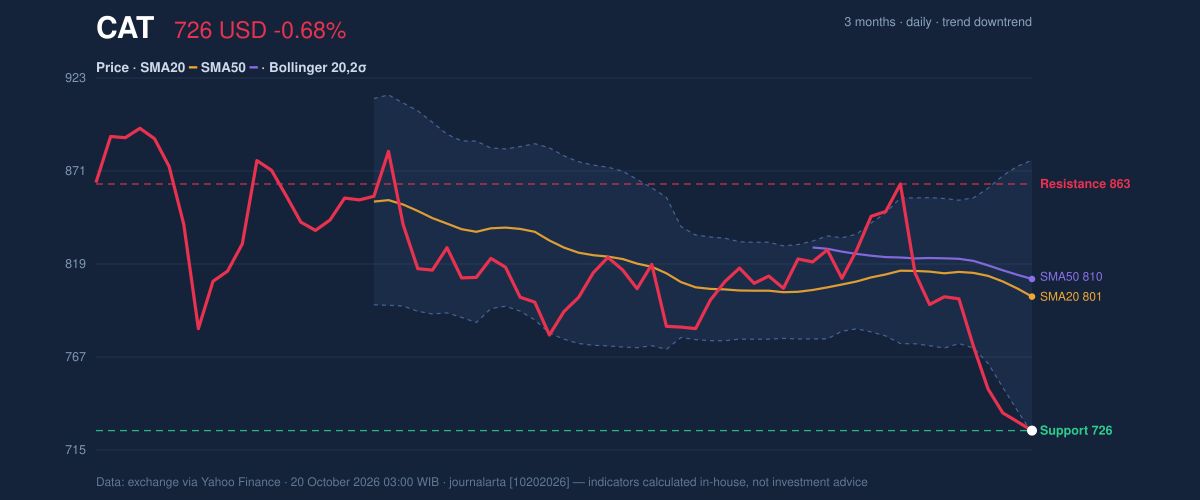
Oscillators & Momentum
The 14-day Relative Strength Index (RSI), a measure of the pace of recent gains and losses, is 29.9, in oversold territory. The Stochastic readings are similarly weak: %K is 12.6 and %D is 15.5, both oversold. These indicators suggest the decline has been forceful enough to leave the stock vulnerable to a pause or rebound. They do not establish that one has begun. The Moving Average Convergence Divergence indicator (MACD), which compares short- and longer-term price momentum, remains negative. MACD is -20.295, below its -9.503 signal line, with a negative histogram of -10.792. That configuration points to downside momentum still outweighing any early sign of stabilization. The indicators therefore send different kinds of information, but not truly opposite signals: RSI and Stochastic describe a market that is stretched, while MACD describes the direction of momentum. The first can warn that selling pressure may be due for relief; the second says the trend has not yet confirmed that relief.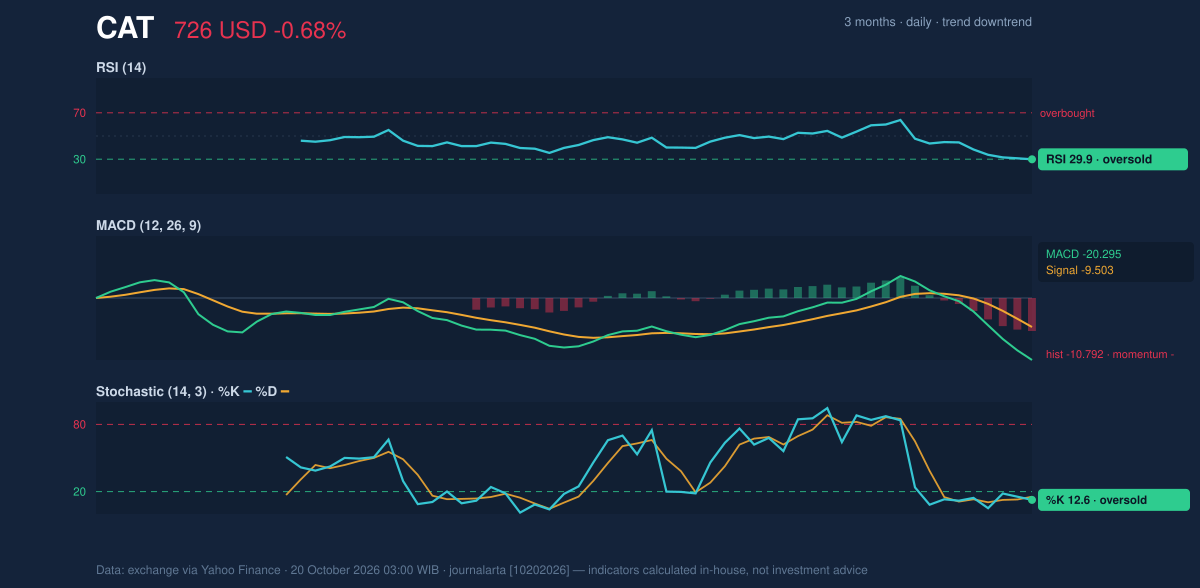
Volatility & Volume
Average True Range (ATR), a gauge of typical price movement, is $30.40, equal to 4.2% of the share price. That is high enough to make day-to-day swings meaningful, and it cautions against treating a small rebound or dip as a decisive change in trend. Trading volume was 2,640,900 shares, close to the 20-day average of 2,552,985. Volume was therefore roughly normal rather than an exceptional surge. On-Balance Volume (OBV), which tracks whether trading volume is associated with rising or falling prices, is declining. That adds a measure of participation to the weakness: the price slide has not yet been accompanied by an improving volume trend.Key Levels & Scenarios
The $725.79 level is the listed 20-day support, and the lower Bollinger Band at $724.39 is nearby. This cluster makes the current area important: holding above it could help the stock stabilize, particularly given the oversold readings. A sustained break below support, however, would weaken that case; the three-month low at $704.01 is the next reference in the supplied data. Support: $725.79; lower Bollinger Band: $724.39. The listed 20-day resistance is $863.44, well above the current price. A move toward it would need to contend first with the 20-day and 50-day averages at $800.57 and $810.43. Those levels can act as resistance while the price remains below them, though crossing them would not alone reverse a falling trend.Technical Verdict: HOLD (wait & see)
Verdict: HOLD (wait & see). The oversold RSI and Stochastic readings make an immediate extension of the decline less certain, but the falling price, negative MACD, declining OBV, and downward-sloping SMA20 do not confirm a reversal. The nearby support and lower Bollinger Band offer a clear test of whether selling is starting to stabilize. - Ideal Entry Range: $724.39–$725.79, based on the lower Bollinger Band and listed support; this is a technical reference range, not a recommendation. - Exit Target: $800.57–$810.43, corresponding to the SMA20 and SMA50 resistance area. - Stop Loss: Below $704.01, the three-month low; the verdict is invalidated if price breaks below $704.01. For non-traders, the chart shows a heavily weakened stock that may be due for a pause, but has not yet shown reliable evidence that its decline has ended. | Indicator | Latest reading | |---|---:| | Last price | $725.79 | | 1-day / 5-day / 1-month change | -0.68% / -9.20% / -11.11% | | SMA20 / SMA50 | $800.57 / $810.43 | | RSI(14) | 29.9 — oversold | | Stochastic %K / %D | 12.6 / 15.5 — oversold | | MACD / signal / histogram | -20.295 / -9.503 / -10.792 | | Bollinger lower / middle / upper | $724.39 / $800.57 / $876.74 | | ATR(14) | $30.40 | | Volume / 20-day average | 2,640,900 / 2,552,985 | | 20-day support / resistance | $725.79 / $863.44 | | Three-month high / low | $935.00 / $704.01 | The latest market data in this analysis are dated October 20, 2026, at 03:00 WIB.Summary Data CAT
| Last price | 725.79 USD |
| Change 1 day / 5 days / 1 month | -0.68% / -9.20% / -11.11% |
| Trend / MA-cross | downtrend / none |
| SMA20 / SMA50 | 800.57 / 810.43 |
| RSI (14) / Stochastic %K | 29.9 / 12.6 |
| Bollinger %B / ATR | 1% / 30.40 |
| Support / Resistance 20 days | 725.79 / 863.44 |
| Data as of | 20 October 2026 03:00 WIB |
Disclaimer: This technical analysis is generated automatically from exchange data (via Yahoo Finance) and indicators calculated by JournalArta, for information and education only. The verdict and the entry, target and stop-loss levels are not investment advice or a solicitation to buy or sell any security. Investment decisions and their risks rest solely with the reader.
Track CAT stock price daily: live levels, support/resistance and our full CAT analysis history.