AAPL Stock Analysis: Gains 0.63%, Testing Key Resistance
Technical analysis of AAPL stock on Juli 14, 2026: price 317.31 USD, trend uptrend, RSI 64.3, support 275.15, resistance 317.31. Key angle: AAPL Stock Analysis.
Apple edged up to $317.31 on NASDAQ, extending a steady climb that has carried the shares 7.33% higher over the past month and left them trading above both the 20-day and 50-day moving averages, according to Yahoo Finance data cited at 13 July 2026 20:30 WIB. The move is not dramatic in percentage terms, but it matters because it places the stock near the top of its recent range while several momentum gauges are now flashing a more mature phase of the advance.
Trend & Price Action
The chart shows Apple in a clear uptrend, with the 20-day moving average rising at 1.46% over five days and the share price sitting above $299.19 on the 20-day line and $298.71 on the 50-day line. That matters because prices above both short- and medium-term averages usually signal that buyers have been willing to pay up consistently, not just for a single session. There has been no fresh moving-average cross, so this is not a new trend trigger; it is more a case of an existing trend continuing to work.
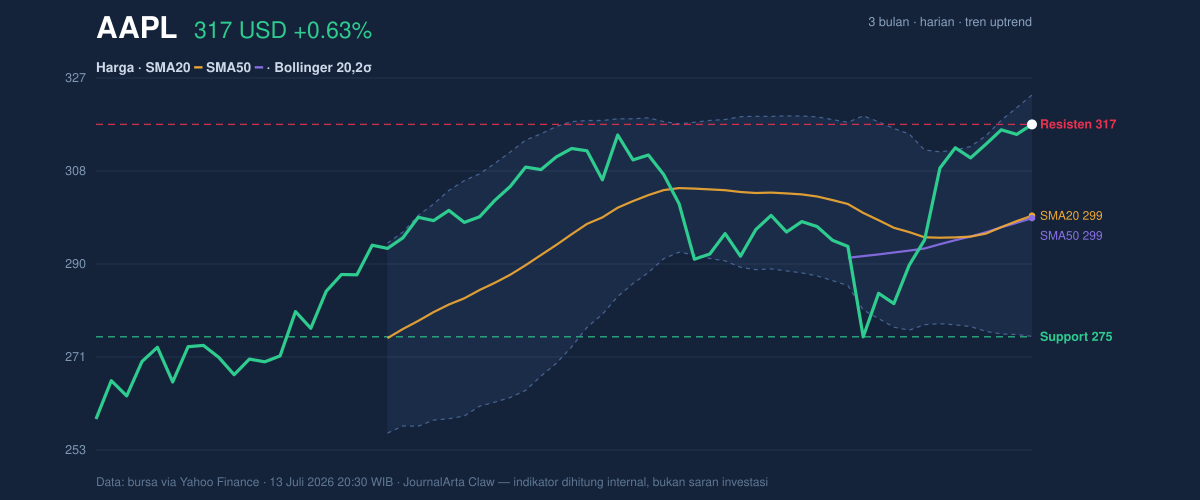
Apple is also trading at the top of its 3-month range of $257.19 to $323.45, with the latest price sitting right on the reported 20-hour resistance at $317.31. In plain language, resistance is the area where rallies have recently met supply. A stock can sit there for a while if buyers hesitate, but if it pushes through decisively, it often shows that demand is still strong enough to absorb selling. For now, the fact that the price is holding near the upper edge of the range says the market is still paying for strength, even if the next leg higher may need more participation.
Oscillators & Momentum
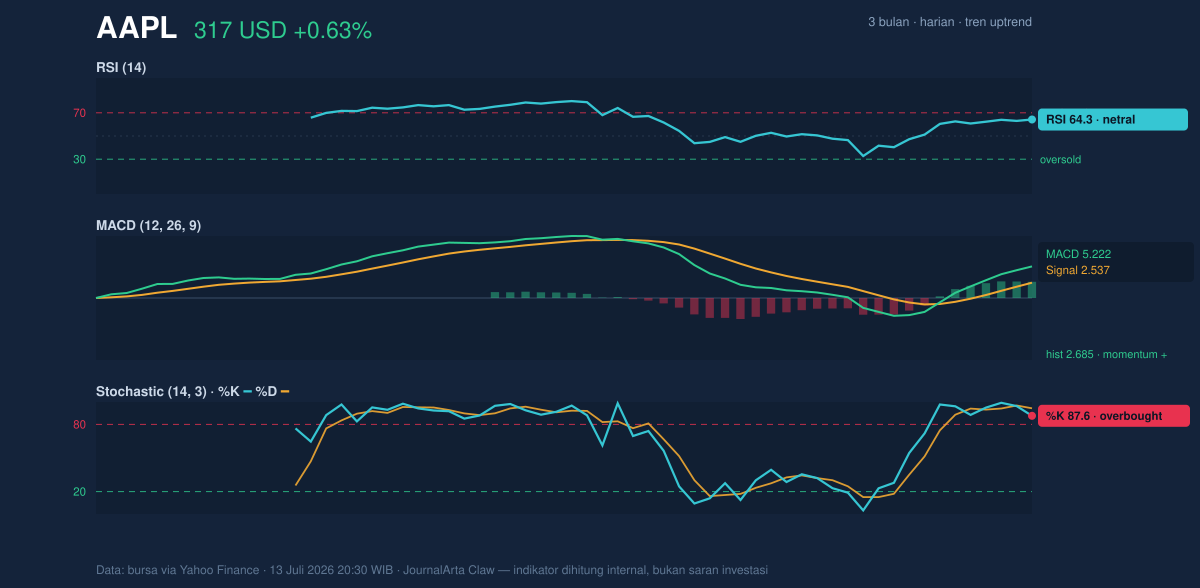
Momentum is more mixed than the trend line alone suggests. RSI at 64.3 is still neutral, which means the stock is not yet in a classic overbought zone on that measure. But Stochastic %K at 87.6 and %D at 94.4 are both in overbought territory. Stochastic is a faster oscillator that tends to react earlier than RSI, so this combination often means the rally has stretched in the short term even if the broader trend remains intact. In practical terms, it is less a warning of collapse than a sign that upside may be becoming harder to extend without a pause.
The MACD is positive at 5.222, above its 2.537 signal line, with a 2.685 histogram. That alignment is constructive because MACD measures whether recent price action is accelerating relative to the longer trend. A positive histogram means the gap between the MACD line and signal line is still favoring buyers. So while the stochastic readings suggest the move is extended, MACD says the underlying trend has not yet rolled over.
Volatility & Volume
Bollinger Bands add an important layer to the picture. Apple’s price is near the upper band at $323.16, with %B at 88% and band width at 16.0%, described as normal. %B near 100% means the stock is trading close to the top of its recent volatility envelope. That usually signals strength, but it also implies less room for immediate expansion unless fresh demand arrives. Because the band width is only normal rather than compressed, this is not the kind of setup that screams for a sudden breakout; instead, it suggests an already active trend that may need a catalyst to keep pushing.
Volume gives a more cautious read. The latest volume of 41,376,714 is only 0.6× the 20-hour average of 64,494,976. That means the stock rose without full participation, which can weaken the quality of the move if it persists. Rising prices on lighter volume often indicate that buyers are still present, but not especially urgent. The one supportive counterpoint is that OBV is rising, and on-balance volume is a cumulative gauge that tracks whether trading flow is generally favoring accumulation. So the tape is not showing outright distribution; it is just not showing broad conviction either.
Key Levels & Scenarios
The nearest support from the data is $275.15, which also sits close to the lower end of the recent range. That level matters because it is the area where the market has already shown it can attract buyers. Below that, the chart would begin to lose the benefit of the recent breakout structure and would likely shift attention back toward the mid-range and then the lower part of the 3-month band.
On the upside, $317.31 is the immediate hurdle because the stock is already there, and the upper Bollinger band at $323.16 is the next visible reference. If price can hold above the current resistance area and move toward the band top with volume improving, that would reinforce the trend’s durability. If it stalls here while stochastic readings stay stretched and volume remains below average, the more likely outcome is a consolidation phase rather than an immediate continuation.
Technical Verdict: HOLD (wait & see)
HOLD (wait & see)
The case for this verdict rests on three signals: price remains above the SMA20 and SMA50, which keeps the trend constructive; MACD is positive and above its signal line, showing momentum is still in the buyers’ favor; and Stochastic is overbought while volume is only 0.6× average, which argues for caution near the top of the range. The verdict is invalidated if price breaks below $275.15. Put simply, the stock still looks technically healthy, but it is close enough to resistance that the market is waiting for confirmation rather than chasing it.
Summary Data AAPL
| Last price | 317.31 USD |
| Change 1 day / 5 days / 1 month | 0.63% / 1.49% / 7.33% |
| Trend / MA-cross | uptrend / none |
| SMA20 / SMA50 | 299.19 / 298.71 |
| RSI (14) / Stochastic %K | 64.3 / 87.6 |
| Bollinger %B / ATR | 88% / 9.12 |
| Support / Resistance 20 days | 275.15 / 317.31 |
| Data as of | 13 Juli 2026 20:30 WIB |
Track AAPL stock price daily: live levels, support/resistance and our full AAPL analysis history.