BP Stock Analysis: Gains 4.82%, Momentum Gains
Technical analysis of BP stock on Juli 14, 2026: price 505.00 GBp, trend sideways, RSI 43.7, support 455.60, resistance 517.00. Key angle: BP Stock Analysis.
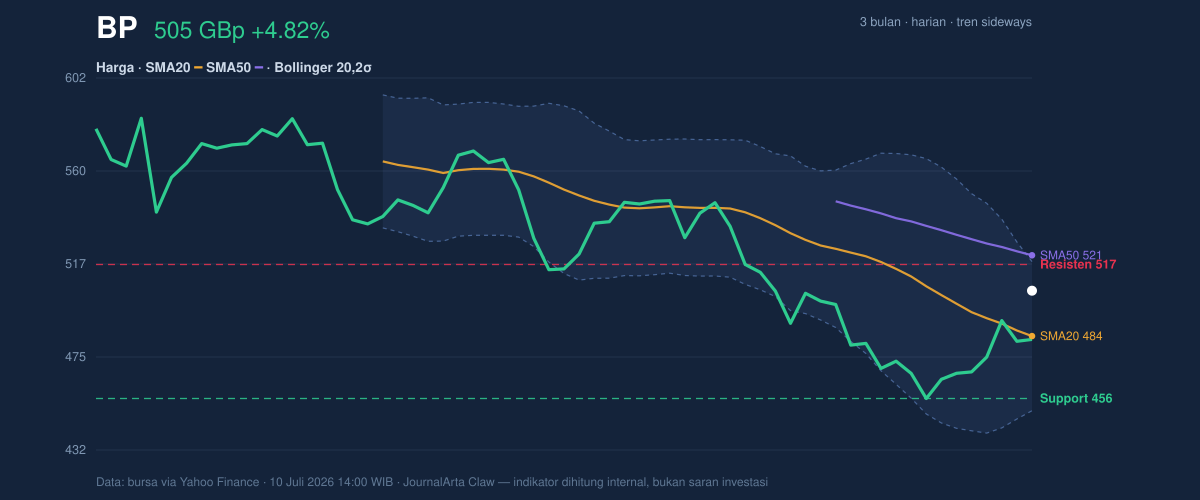
BP plc is trading back above its short-term average, but the shares are still working through a broader sideways pattern that has capped momentum for weeks. The latest move matters because it shows buyers have reappeared near the middle of the recent range, even as longer-term trend pressure from the weaker SMA20 slope and the still-lower SMA50 keeps the chart from looking decisively repaired.
Trend & Price Action
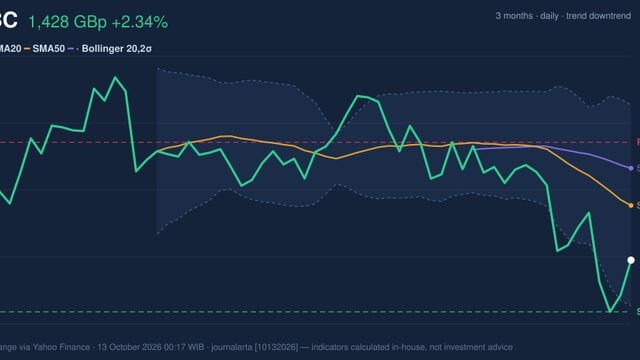
According to data from the LSE via Yahoo Finance, BP closed at 505.00 GBp, up from a previous close of 481.80. That puts the stock above its SMA20 at 484.16 but still below its SMA50 at 521.19, a setup that usually signals a market that has recovered from short-term weakness but has not yet proven a full trend reversal. The absence of a new MA-cross reinforces that reading: there is no fresh moving-average signal confirming a new sustained leg higher.
The shape of the chart is best described as range-bound. The stated trend is sideways, and the SMA20 slope of -2.98% over 5 days shows that the short-term average is still leaning lower, even though price has moved back above it. That combination often means rallies are being met by sellers before they can develop into a clean breakout. In plain terms, BP is no longer sliding in a straight line, but it is also not yet trending with conviction.
The stock is now trading near the upper part of its recent band, at around 80% of the 20-hour range, with support at 455.60 and resistance at 517.00. The 3-month range adds context: BP is sitting well below the 3-month high of 592.00, but comfortably above the 3-month low of 450.60. That positioning suggests the market has repaired part of the recent damage, yet it remains inside a broader consolidation rather than a breakout phase.
Oscillators & Momentum
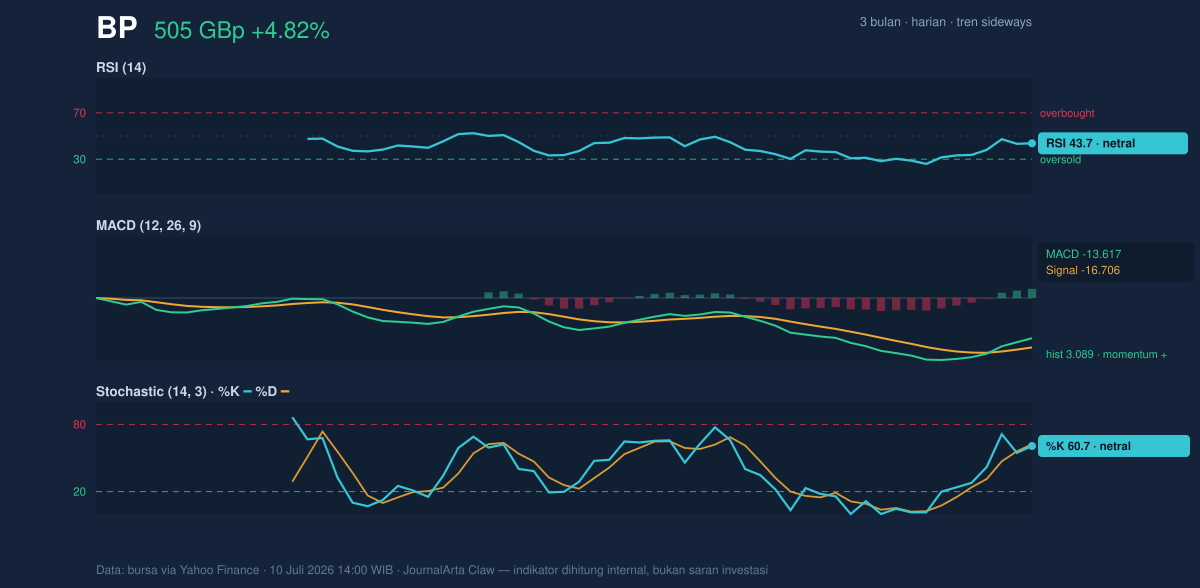
The momentum picture is mixed, and that is important. The RSI at 43.7 is neutral, which means the shares are neither overbought nor oversold. For readers less familiar with the term, RSI is a gauge of how stretched a move is; a reading around the mid-40s usually says the market has room to move either way, but no strong momentum edge is currently visible.
The Stochastic %K at 60.7 and %D at 62.2 are also neutral. Stochastic measures where the price sits within its recent trading range. Readings in the low 60s suggest BP is recovering, but not in an overheated way. More importantly, the oscillator is not flashing a reversal warning from an extreme zone, so the chart does not yet look exhausted.
The most constructive signal comes from MACD at -13.617, with the signal line at -16.706 and a positive histogram of 3.089. MACD compares short- and medium-term momentum; when the histogram turns positive, it usually means downside pressure is fading and the faster line is moving ahead of the slower one. That does not automatically mean a trend is bullish, but it does mean the recent rebound has internal support rather than being just a one-day bounce.
Volatility & Volume
BP’s ATR(14) of 11.07, equal to 2.2% of price, points to moderate volatility. ATR is a measure of typical daily movement, and a mid-range reading like this usually implies the shares can still move meaningfully without being in a panic phase. The Bollinger Band width of 14.1% is described as normal, which means the chart is not in a volatility squeeze that often precedes a sharp breakout. Instead, the market appears to be trading in an ordinary range, with the %B at 81% showing price is leaning toward the upper part of that band.
That upper-band position is constructive but not decisive. It says the stock has enough near-term strength to test the top of its range, yet it has not pushed so far beyond it that a breakout is confirmed. In other words, the chart is pressing against resistance, but it has not broken the door down.
Volume adds a note of caution. Last volume was 25,271,645, below the 20-hour average of 38,812,640, or about 0.7x normal. That means the latest advance was not backed by heavy participation. When price rises on lighter volume, the move can still be valid, but it is usually less persuasive than a rally accompanied by broad trading activity. The good news is that OBV is rising, which suggests cumulative buying pressure has been improving even if the latest session was not especially busy.
Key Levels & Scenarios
The market will likely keep focusing on the 517.00 resistance line first. A move through that area would matter because it would place BP above the top of the recent 20-hour range and closer to the SMA50 at 521.19, where the chart would begin to look more balanced. Until then, the shares remain in a test phase rather than a confirmed trend change.
On the downside, 455.60 support is the main line to watch. That level sits just above the 3-month low of 450.60, so a drop through it would risk reopening the lower end of the broader range. If price fails at resistance and rolls over, the chart would likely return to its sideways pattern with a weaker bias. If it holds above support and the MACD improvement continues, the current rebound has a better chance of extending.
Technical Verdict: HOLD (wait & see)
HOLD (wait & see) because the price is back above the SMA20, the MACD histogram is positive, and OBV is rising, which together show improving short-term participation; however, the price remains below the SMA50, the RSI and Stochastic are still neutral, and the broader chart is still described as sideways. The verdict is invalidated if price falls below 455.60.
In plain English: BP has improved, but the chart still needs more proof before the move can be called a real trend change.
Summary Data BP
| Last price | 505.00 GBp |
| Change 1 day / 5 days / 1 month | 4.82% / 8.10% / -5.52% |
| Trend / MA-cross | sideways / none |
| SMA20 / SMA50 | 484.16 / 521.19 |
| RSI (14) / Stochastic %K | 43.7 / 60.7 |
| Bollinger %B / ATR | 81% / 11.07 |
| Support / Resistance 20 days | 455.60 / 517.00 |
| Data as of | 10 Juli 2026 14:00 WIB |
Track BP share price daily: live levels, support/resistance and our full BP analysis history.