Testing Key Resistance, HSBC Stock Gains 0.38% Today
Technical analysis of HSBC stock on Juli 14, 2026: price 1,462.00 GBp, trend uptrend, RSI 63.7, support 1,384.60, resistance 1,471.00. Key angle: Testing Key…
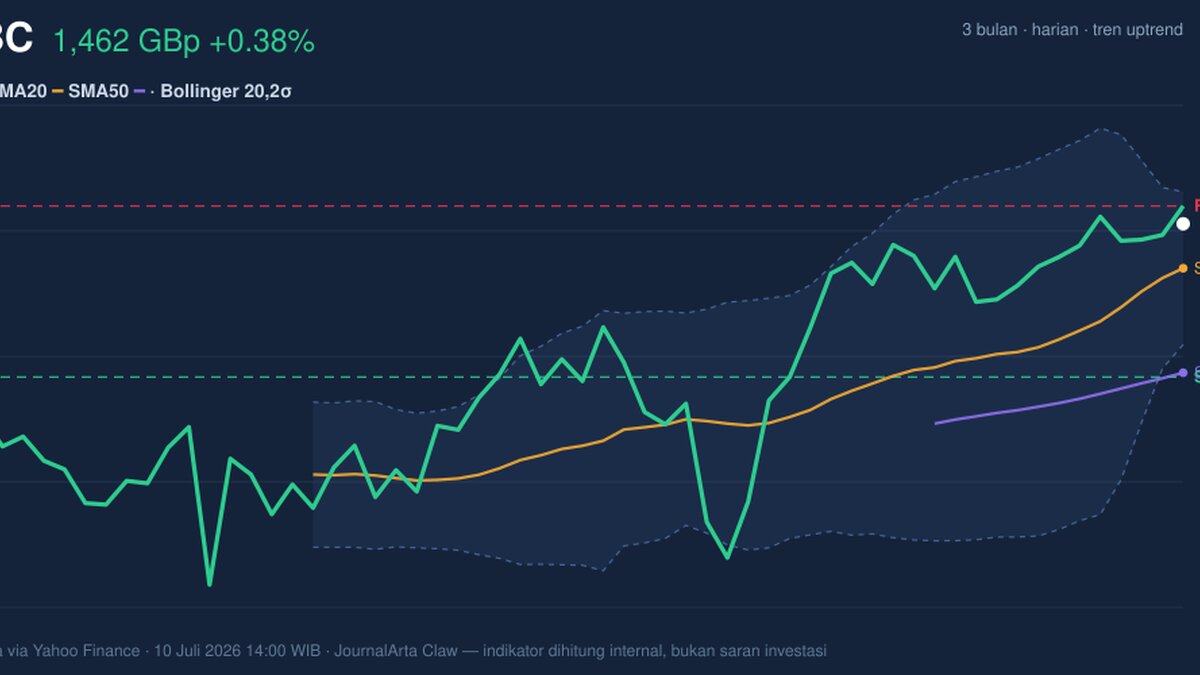
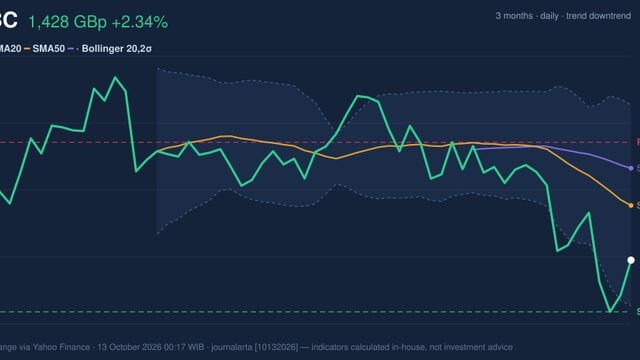
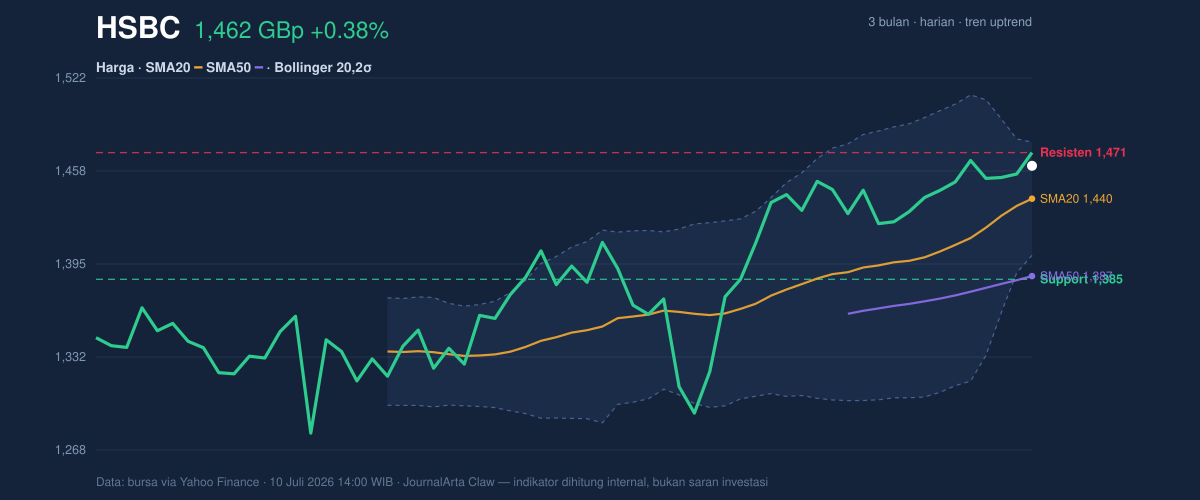
HSBC Holdings shares on the LSE closed at 1,462.00 GBp, up 0.38% on the day and 6.50% over the past month, with the stock now trading above its short- and medium-term moving averages, according to data from Yahoo Finance. That placement matters: it shows the recent advance is not just a one-day pop, but a price trend that has pushed the shares into the upper half of their recent range. The chart also shows the stock sitting just below nearby resistance, while momentum remains constructive rather than overheated.
Trend & Price Action
The clearest signal is the trend structure. HSBC is in an uptrend, with the price above the SMA20 at 1,439.57 and the SMA50 at 1,386.80 still well below current trading. In plain terms, the recent price is running ahead of both its short-term and longer-term averages, which usually tells traders that buyers have been in control for more than a few sessions. The SMA20 slope of 2.24% over 5 days confirms that the short-term trend is still rising rather than flattening out. There is no new MA-cross, so this is not a fresh breakout signal from a moving-average crossover; instead, it is a continuation pattern, where the market is extending an existing move rather than starting one from scratch.
The shares are also trading near the top of the recent band. With support at 1,384.60 and resistance at 1,471.00, the stock is already in the upper part of that 20-hour range, at roughly 90% of the span. That positioning tells you the market is pressing against the ceiling rather than drifting in the middle. As shown in the chart, this is the sort of setup that can either lead to a clean push through resistance or a pause if demand fades.
Oscillators & Momentum
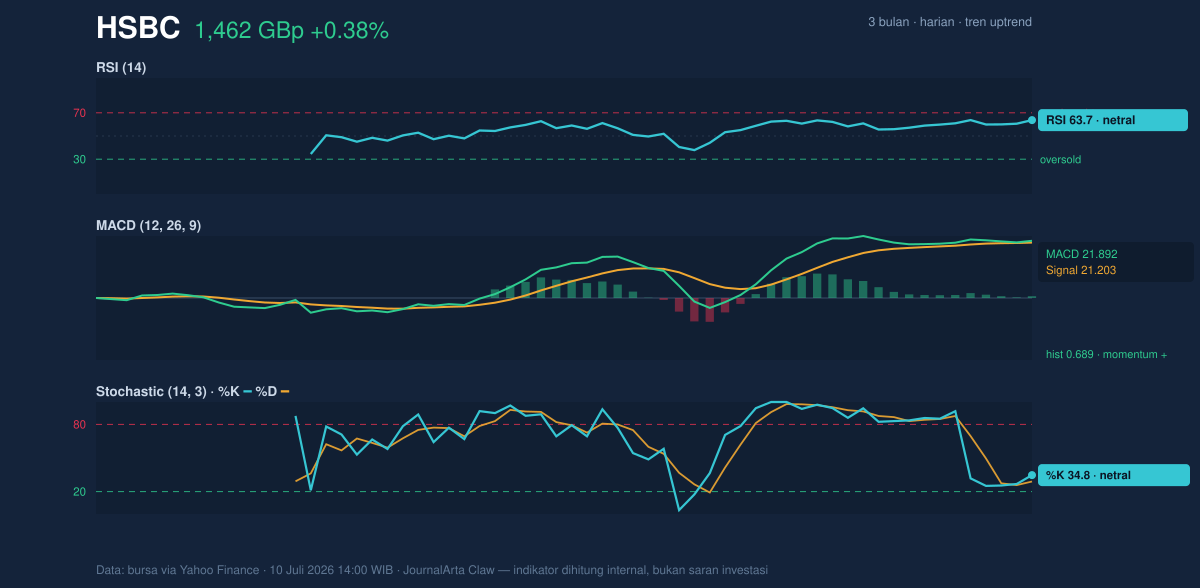
Momentum is supportive, but not extreme. The RSI at 63.7 sits in neutral territory, which means the stock is not yet flashing a classic overbought warning even after the recent rise. That is important: a stronger RSI reading would suggest the move may be getting stretched, but this level implies there is still room for the trend to continue if buyers stay engaged. The Stochastic %K at 34.8 and %D at 29.0 are also neutral, which signals that the stock is not in a momentum exhaustion zone. Stochastic measures where the close sits within the recent range, so a reading like this suggests the shares have recovered, but have not yet reached the kind of elevated position that often precedes a fast pullback.
The most encouraging indicator is the MACD at 21.892 above its signal line at 21.203, with a positive histogram of 0.689. In practical terms, MACD is a trend-following gauge: when it sits above the signal line, it suggests upward momentum is still intact. The positive histogram means that gap is still in the market’s favor, although not by a huge margin. As shown in the chart, momentum is aligned with the trend, but it is not accelerating aggressively.
Volatility & Volume
Volatility is moderate, and the Bollinger Band structure adds an important layer to the story. The upper band at 1,478.14 is close to the current price, while the %B reading of 79% shows HSBC is trading in the upper portion of the band but not yet pressing the very top. That usually means the market is strong, though not wildly extended. More interestingly, the band width of 5.4% is narrowing, which points to a squeeze. A squeeze often means the market has been compressing energy; when price is already near the upper band, that compression can resolve into a directional move. The direction is not guaranteed, but the setup does tell traders the next meaningful move may be larger than the recent day-to-day drift.
ATR at 35.42, equal to 2.4% of price, suggests daily swings are moderate rather than unusually sharp. That matters because a stock can sit near resistance without necessarily being fragile; ATR says the share can still move meaningfully without being in panic territory. Volume, however, is a caution flag. The latest turnover of 14,955,487 is only 0.7× the 20-hour average of 22,635,521, so the recent rise has not been backed by heavy participation. That does not break the trend, but it does weaken the conviction behind the move. The positive note is that OBV is rising, which indicates cumulative buying pressure has still been improving even if the latest session was not especially active.
Key Levels & Scenarios
The immediate level to watch is 1,471.00 resistance. A sustained move above that area would show the market is no longer just testing the top of the recent range; it would suggest the squeeze is resolving upward. On the downside, 1,439.57 — the SMA20 — is the first meaningful trend marker, because a loss of that level would imply short-term momentum is fading. Below that, 1,384.60 support is the more important floor, since it anchors the recent range and sits close to the trend’s lower boundary. The broader 3-month range, from 1,256.20 to 1,590.00, shows there is still plenty of historical room above and below, but the current battle is being fought much closer to the upper half of that band.
Technical Verdict: HOLD (wait & see)
HOLD (wait & see) because the trend is positive, MACD remains above its signal line, and the price is holding above the SMA20 and SMA50, but the move is sitting close to 1,471.00 resistance while volume is only 0.7× normal. The Bollinger squeeze suggests a larger move may be coming, yet the market has not shown enough participation to call that move decisively one way or the other. This verdict is invalidated if price falls below 1,384.60.
For non-traders: HSBC is trending better, but it is still testing whether the recent strength can turn into a cleaner breakout.
Latest 3-month high: 1,590.00.
Summary Data HSBC
| Last price | 1,462.00 GBp |
| Change 1 day / 5 days / 1 month | 0.38% / 0.76% / 6.50% |
| Trend / MA-cross | uptrend / none |
| SMA20 / SMA50 | 1,439.57 / 1,386.80 |
| RSI (14) / Stochastic %K | 63.7 / 34.8 |
| Bollinger %B / ATR | 79% / 35.42 |
| Support / Resistance 20 days | 1,384.60 / 1,471.00 |
| Data as of | 10 Juli 2026 14:00 WIB |
Track HSBC share price daily: live levels, support/resistance and our full HSBC analysis history.