Testing Support Level, AstraZeneca Stock Drops 5.57% Today
Technical analysis of AstraZeneca stock on Juli 14, 2026: price 12,610.00 GBp, trend sideways, RSI 36.3, support 12,834.00, resistance 14,538.00.
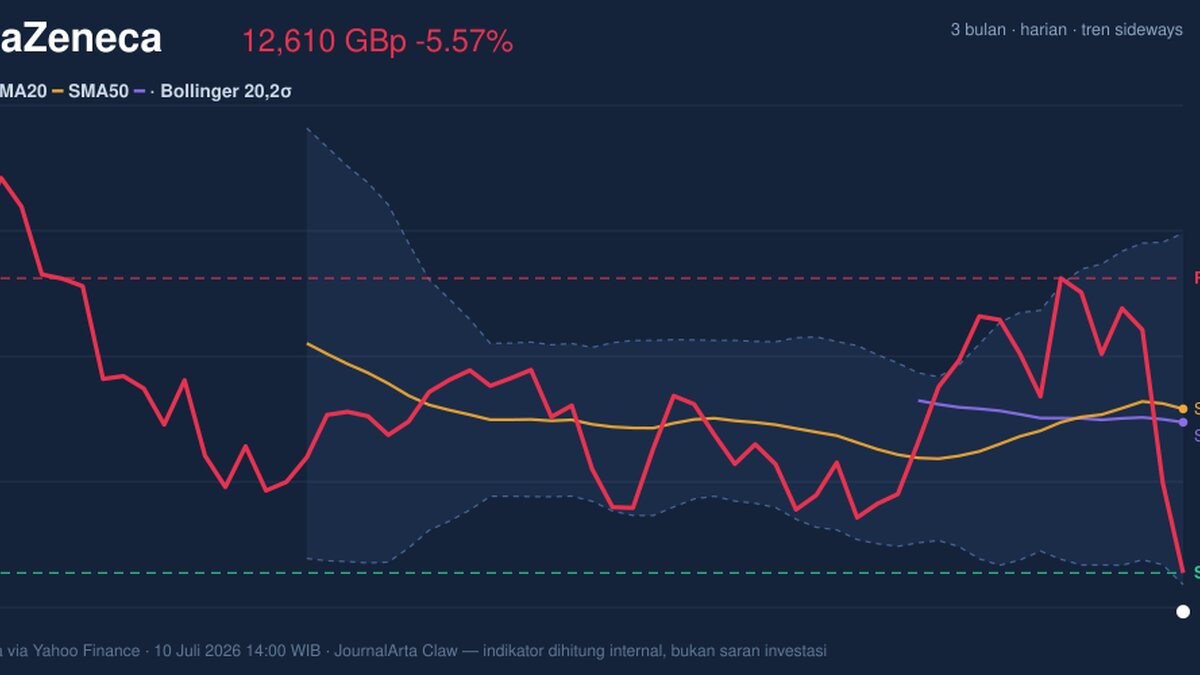
Reuters-style price action on AstraZeneca’s London listing shows the shares fell to 12,610.00 GBp by 10 July 2026 14:00 WIB, a sharp 5.57% one-day drop that pushed the stock below its short-term trend markers and deeper into the lower half of its recent range. The move matters because it is not just a one-session wobble: the stock is also down 12.77% over five days and 6.33% over one month, a pattern that suggests sellers have been in control long enough to shift the tone from routine volatility to a more sustained technical setback.
Trend & Price Action
The chart shows AstraZeneca trading below SMA20 at 13,782.60 and below SMA50 at 13,705.00, which is a clear sign that near-term price has slipped under both its faster and slower moving averages. In plain English, that means the shares are no longer merely pausing inside an uptrend; they are trading underneath the levels that often act as dynamic support. With no fresh MA cross and the stated trend still sideways, the message is less about a clean trend reversal and more about a market that has lost upward traction and is now testing whether the range can hold.
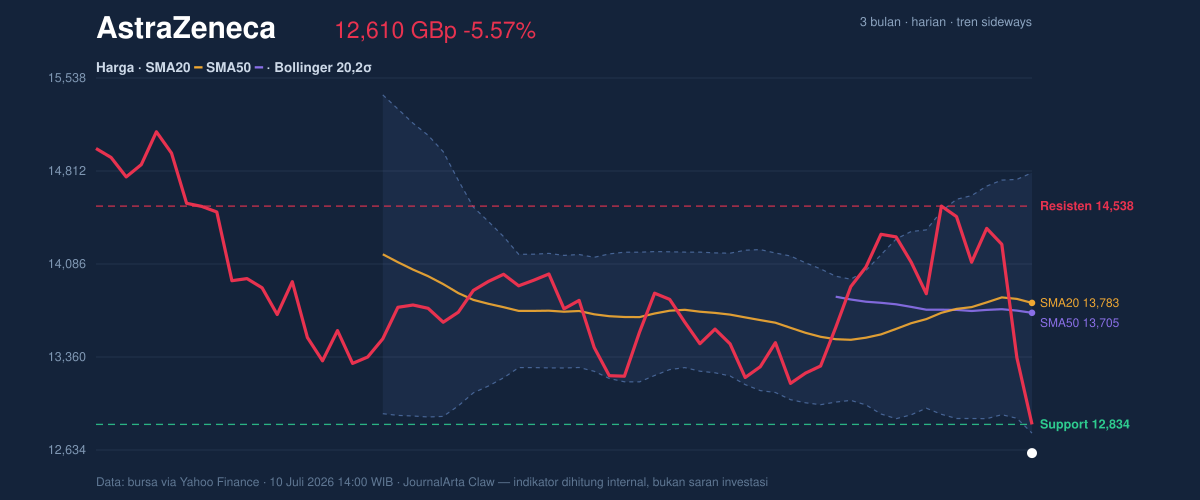
The position inside the banded range is also telling. AstraZeneca sits 13% below the 20-hour support at 12,834.00 and well beneath the 20-hour resistance at 14,538.00, which means the stock is not probing the top of the range; it is leaning toward the lower edge. The 3-month high of 15,130.00 and 3-month low of 11,232.00 frame the broader context. The current price is still above that low, but the distance has narrowed enough to show that the recent decline is no longer just noise within a broad range. That is the sort of setup where traders watch whether support attracts buyers quickly, or whether the stock keeps drifting toward the lower bound.
Oscillators & Momentum
The momentum picture is mixed, but not comforting. RSI at 36.3 is still technically neutral, yet it is close enough to the oversold zone to show pressure has built. More importantly, Stochastic %K at 19.4 versus %D at 41.9 is already in oversold territory, which often signals that the selloff is stretched in the short run. That does not guarantee a bounce, but it does mean downside momentum may be nearing the point where it needs fresh selling to continue lower.
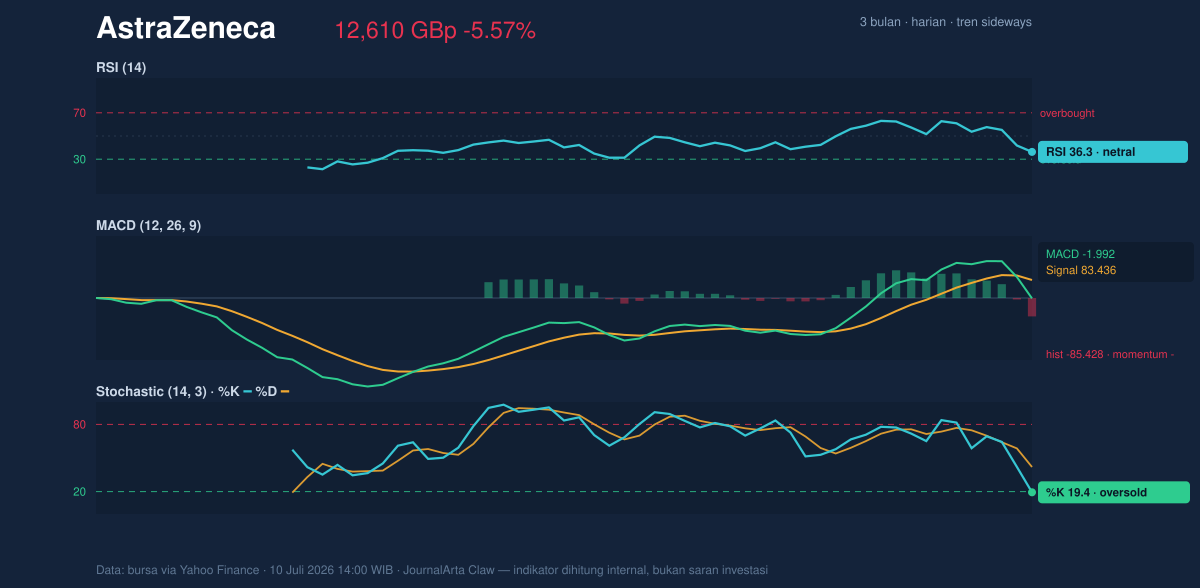
The bigger warning comes from MACD at -1.992 with a signal line at 83.436 and a histogram of -85.428. For readers unfamiliar with the term, MACD is a trend-following momentum gauge: when it is negative and the histogram is deeply below zero, price is losing force rather than merely fluctuating. In this case, the oscillator stack is not aligned with the idea of a healthy base. RSI is only mildly weak, Stochastic is oversold, but MACD remains decisively negative, which usually means any rebound would need to prove itself before it can be trusted as more than a reflex rally.
Volatility & Volume
Volatility is elevated, not explosive. ATR(14) at 599.71, or 4.8% of price, indicates the stock is capable of meaningful daily swings, and that matters because a move below support can travel farther when the average true range is high. At the same time, the Bollinger setup is not signaling a volatility squeeze that often precedes a sharp breakout. The 20-day band width of 14.8% is described as normal, which suggests the stock is not coiling for a dramatic compression move; instead, it is already in a fairly active environment.
The band position is more important than the width here. With price below the Bollinger middle band at 13,782.60 and even below the lower band at 12,765.90, the shares are trading outside the lower statistical envelope. That is usually a sign of stress, but it can also mean the market is temporarily overextended to the downside. The %B at -8% reinforces that point: price has moved beyond the lower band, which often happens when selling is intense enough to push the stock into an exhausted zone. Volume supports the seriousness of the move. 3,355,018 shares traded versus a 20-hour average of 2,567,841, or 1.3x normal, while OBV is falling. Rising volume on a down day, combined with declining on-balance volume, typically means the move is being confirmed by participation rather than dismissed as thin trading.
Key Levels & Scenarios
The immediate technical map is straightforward. 12,834.00 is the nearest support to watch, and the current price has already slipped below it. That makes the next question whether the market can reclaim that zone quickly, or whether it will treat it as new resistance. Above that, 13,782.60 and 13,705.00 are the moving-average levels that would need to be recovered to show the damage is easing. On the upside, 14,538.00 remains the main near-term resistance, and a move back toward it would require a clear shift in momentum first.
If the shares fail to regain 12,834.00, the chart leaves room for further pressure toward the lower part of the 11,232.00 to 15,130.00 three-month range. If, instead, price reclaims the lower Bollinger area at 12,765.90 and then holds above 13,705.00, the market would begin to look less fragile. For now, the burden of proof remains with the bulls, because the stock is trading beneath both moving averages, below the lower band, and with negative momentum still in force.
Technical Verdict: HOLD (wait & see)
HOLD (wait & see) because price is below SMA20 and SMA50, MACD remains negative with a deeply bearish histogram, and OBV is falling even as volume runs above average. The main invalidation would be a decisive break back above 13,782.60 and 13,705.00, which would show the stock is regaining its short-term footing. In plain English: the shares are under pressure, but the indicators do not yet show a clean enough trend to call the move finished.
3,355,018 shares traded versus a 20-hour average of 2,567,841.
Summary Data AstraZeneca
| Last price | 12,610.00 GBp |
| Change 1 day / 5 days / 1 month | -5.57% / -12.77% / -6.33% |
| Trend / MA-cross | sideways / none |
| SMA20 / SMA50 | 13,782.60 / 13,705.00 |
| RSI (14) / Stochastic %K | 36.3 / 19.4 |
| Bollinger %B / ATR | -8% / 599.71 |
| Support / Resistance 20 days | 12,834.00 / 14,538.00 |
| Data as of | 10 Juli 2026 14:00 WIB |
Track AstraZeneca share price daily: live levels, support/resistance and our full AstraZeneca analysis history.