Shell Stock Technicals Today: Gains 2.24%, Testing Key Resistance
Technical analysis of Shell stock on Juli 14, 2026: price 3,109.00 GBp, trend sideways, RSI 50.3, support 2,872.50, resistance 3,080.50.
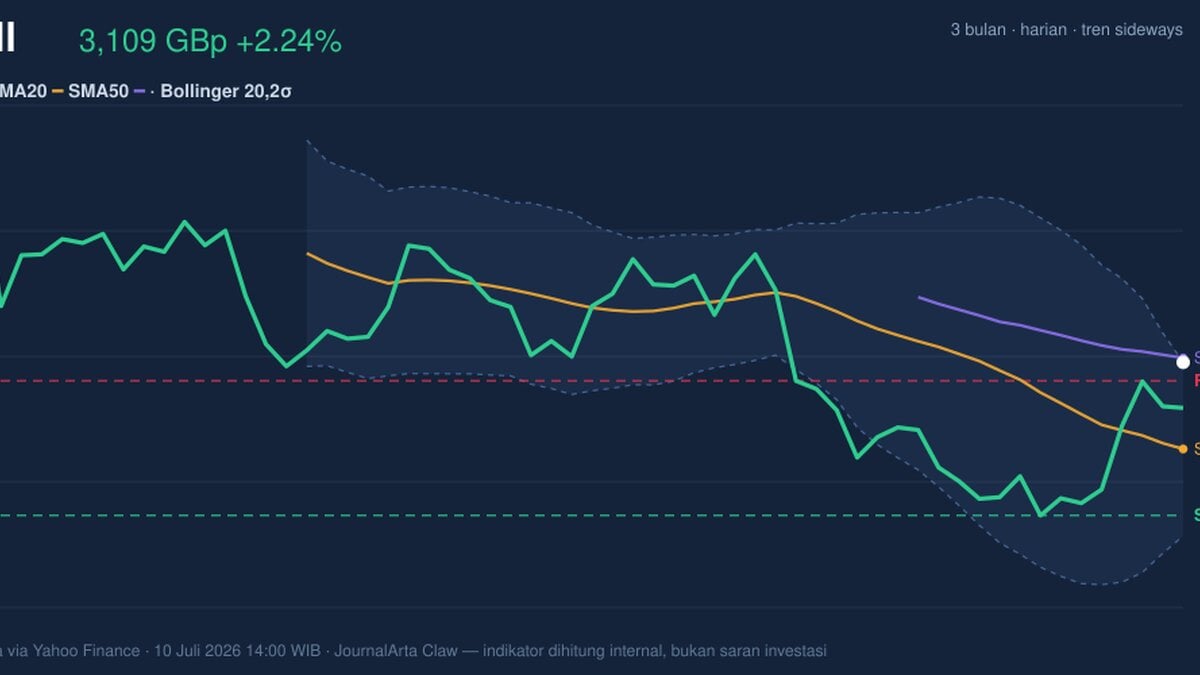
Shell plc edged higher on the LSE to 3,109.00 GBp on 10 July 2026, rising 2.24% from the previous close as the shares pushed to the top of their recent trading band. The move matters less as a headline rally than as a test of whether buyers can hold the stock above short-term resistance while broader trend signals remain mixed, as shown in the chart.
Trend & Price Action
The share price is still described as sideways, but the latest close sits above the SMA20 at 2,975.05 and just below the SMA50 at 3,115.93, which places Shell in a narrow decision zone rather than a clean uptrend or downtrend. That positioning is important: it suggests the market has recovered from short-term weakness, yet has not fully won back the medium-term trend line that often acts as a filter for whether a rebound has real follow-through.
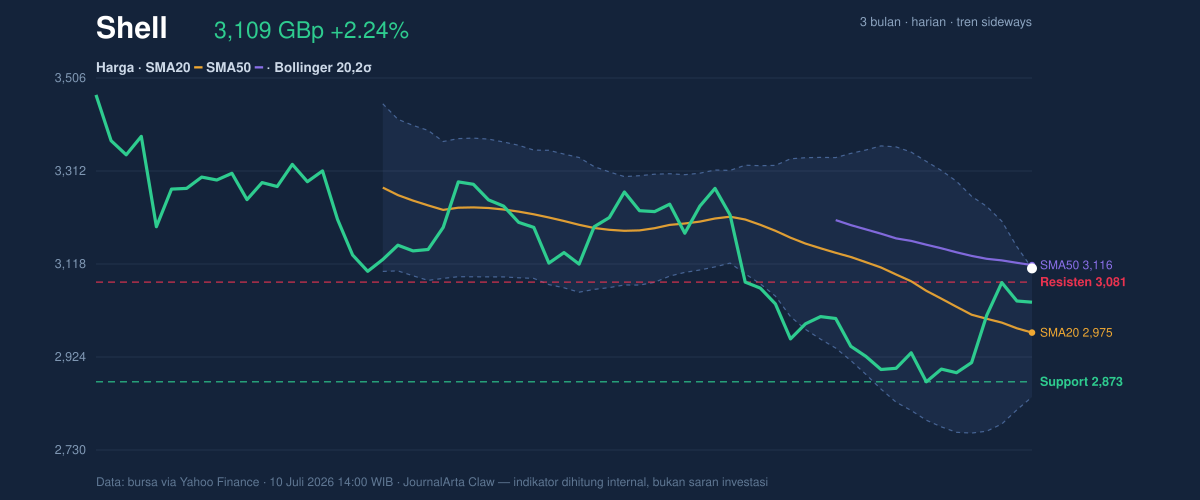
The SMA20 slope is still negative at -1.78% over 5 days, so the short-term average is not yet turning up decisively. In plain language, that means the recent bounce is happening while the underlying short-term trend is still leaning down, which often produces choppy trading unless buyers can keep pressing through nearby resistance.
Shell is also trading near the top of its 20-day Bollinger band, with the upper band at 3,109.33 and the price at 3,109.00. That is a technical way of saying the shares are stretched to the upper edge of their recent range, which can signal strength, but also leaves less room for error if momentum fades.
Oscillators & Momentum
The momentum picture is more constructive than the trend picture. RSI at 50.3 is neutral, which usually means the market is neither strongly overbought nor oversold and still has room to move either way. That neutrality matters because it leaves the door open for continuation if other indicators keep improving.
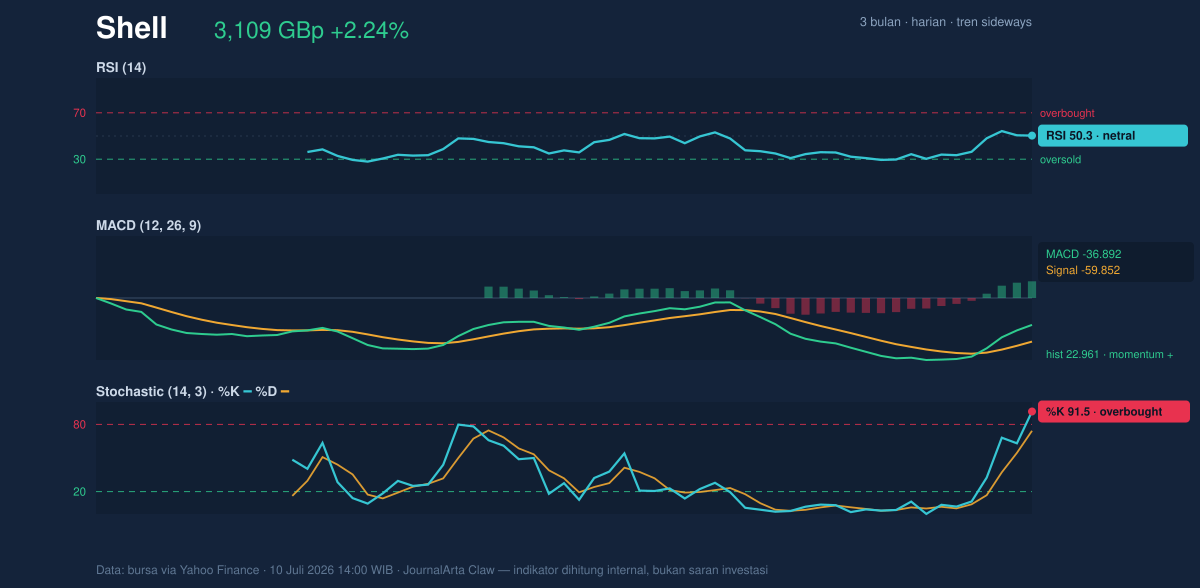
The more aggressive signal comes from the stochastic oscillator, where %K is 91.5 and %D is 74.3. Stochastic measures where the share price sits within its recent range, so readings this high indicate the stock is trading near the top of that range and may be vulnerable to a pause or pullback if buyers lose urgency. In other words, this is a sign of strength, but also a warning that the move is getting crowded in the short run.
The MACD setup is more supportive. MACD is -36.892, still below zero, but the histogram is +22.961 and the MACD line is above the signal line at -59.852. That combination usually means downside pressure is easing and short-term momentum is improving before the broader trend fully turns. It is not a confirmed bullish regime, but it is a better reading than a flat or negative histogram would give.
Volatility & Volume
Volatility is contained rather than explosive. ATR at 91.13, or 2.9% of price, points to moderate daily movement, while Bollinger band width at 9.0% is normal rather than compressed or unusually wide. This matters because a normal band width with price pinned near the upper band often suggests the market is moving with discipline, not panic; it also means any breakout attempt may need fresh participation to stick.
That participation has not been especially strong yet. Volume of 6,398,134 is only 0.7× the 20-day average of 9,427,538, so the latest rise is not being backed by heavy turnover. In market terms, that weakens the conviction of the move: prices can drift higher on thin volume, but sustained advances usually need broader buying interest.
Still, OBV is rising, which is a useful counterpoint. On-balance volume tracks whether volume is supporting price direction over time, and a rising OBV suggests buyers have been accumulating shares even if the most recent session was not especially busy. That makes the current move look healthier than the raw volume number alone would imply.
Key Levels & Scenarios
The immediate reference points are clear. Support at 2,872.50 is the first level where buyers have recently been willing to step in, while resistance at 3,080.50 has already been exceeded, leaving the next test around the SMA50 at 3,115.93. The stock is now trading at 114% of the support-resistance range, which shows it has moved well beyond the midpoint and is attempting to convert resistance into support.
That setup is constructive only if the price can stay above the breakout zone. If Shell slips back below 3,080.50, the move starts to look like a failed push rather than a genuine shift in control. If it can hold above the SMA50 at 3,115.93, the chart would begin to show a more convincing recovery from the recent sideways pattern, especially if volume expands and the stochastic eases out of overbought territory without a sharp price reversal.
The broader 3-month range gives context to both sides of the trade. Shell remains well below the 3,758.50 high and comfortably above the 2,559.50 low, which tells readers the stock is not in a panic phase, but also not close to reclaiming its full earlier range. It is, instead, trying to build a base in the middle of that corridor.
Technical Verdict: HOLD (wait & see)
The case for HOLD (wait & see) rests on three things: MACD is improving with a positive histogram, OBV is rising, and price is holding above the SMA20. But the verdict is tempered by the fact that stochastic is overbought, volume is only 0.7× normal, and the broader trend is still sideways with a negative SMA20 slope.
This verdict is invalidated if price breaks and stays below 2,872.50.
For non-traders, that means Shell looks firmer than it did a few days ago, but the chart has not yet proven that the recovery is strong enough to trust fully. “What matters now is whether this bounce can survive the next test above 3,115.93,” one London trader said, “because thin volume can disappear fast.”
Summary Data Shell
| Last price | 3,109.00 GBp |
| Change 1 day / 5 days / 1 month | 2.24% / 7.52% / -3.46% |
| Trend / MA-cross | sideways / none |
| SMA20 / SMA50 | 2,975.05 / 3,115.93 |
| RSI (14) / Stochastic %K | 50.3 / 91.5 |
| Bollinger %B / ATR | 100% / 91.13 |
| Support / Resistance 20 days | 2,872.50 / 3,080.50 |
| Data as of | 10 Juli 2026 14:00 WIB |
Track Shell share price daily: live levels, support/resistance and our full Shell analysis history.