DBS Stock Technicals Today: Gains 3.09%, RSI Overbought
Technical analysis of DBS stock on Juli 16, 2026: price 72.98 SGD, trend uptrend, RSI 83.6, support 65.01, resistance 72.03. Key angle: DBS Stock Technicals.
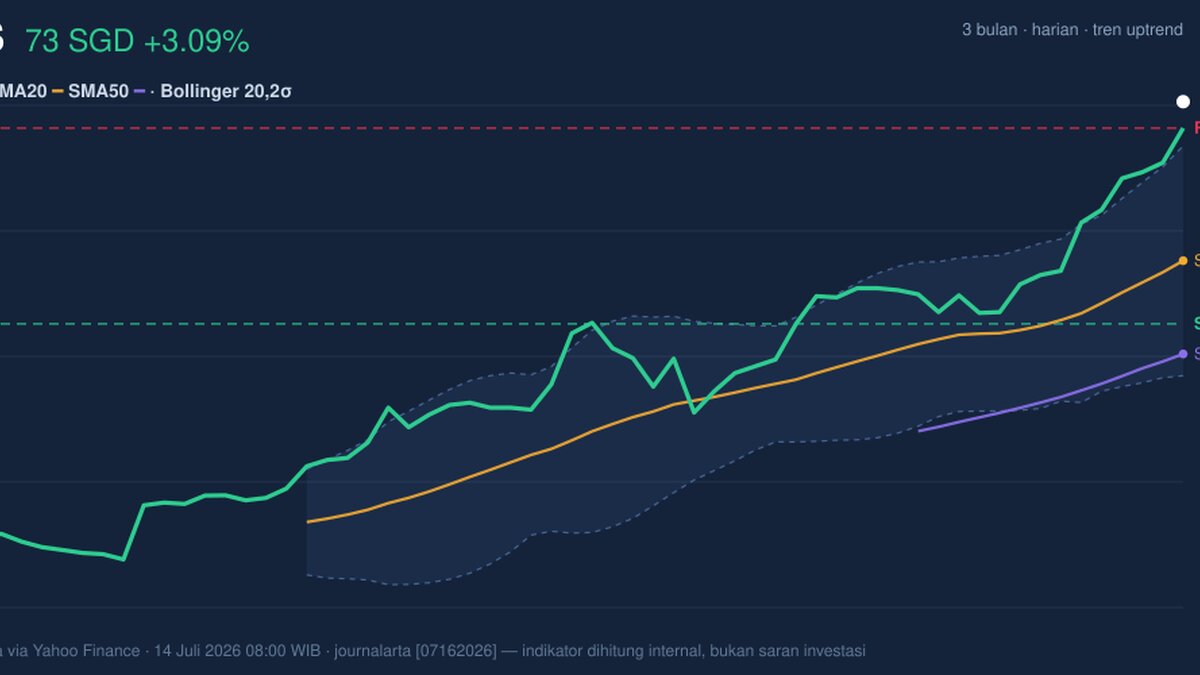
DBS Group Holdings (DBS) surged to a last price of 72.98 SGD as of July 14, 2026, marking a aggressive 3.09% single-day gain that shattered previous technical ceilings. This move, supported by a broader monthly expansion of 14.51%, places the stock well beyond its three-month high of 72.23 SGD. The market is currently pricing in substantial optimism, pushing the bank’s equity into uncharted territory relative to its recent trading range.
Trend and Price Structure
The structural integrity of the current rally is clear: DBS is in a robust uptrend, with the SMA20 at 67.27 providing a comfortable cushion well below the current price. Notably, the SMA20 is sloping upward at 2.88% over 5 days, reflecting an acceleration in buyer conviction rather than a mere crawl. By trading significantly above both the SMA20 (67.27) and SMA50 (63.93), the stock maintains a healthy distance from its medium-term averages, confirming that the bulls are currently in complete control of the narrative.
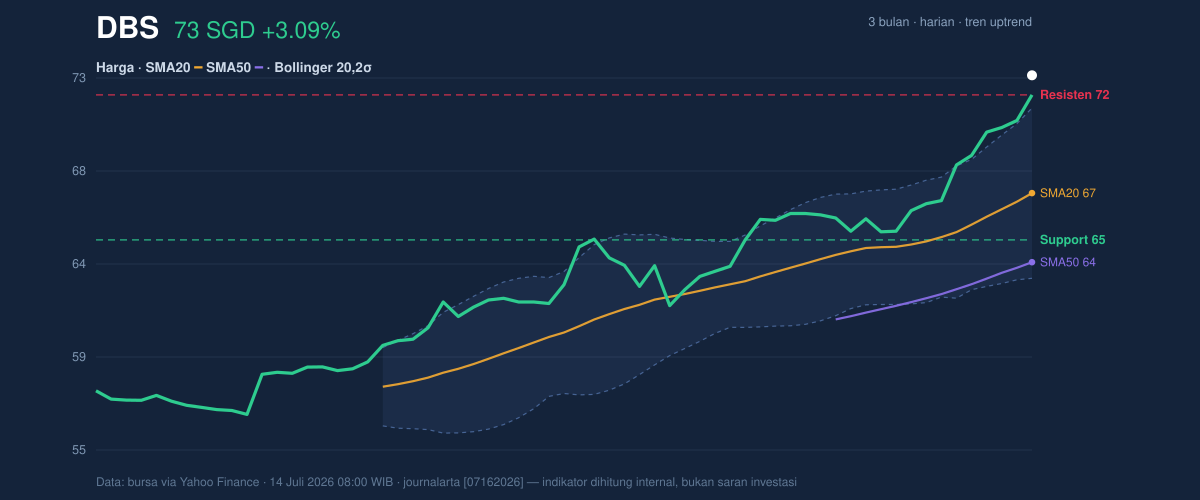
The breakout is underscored by the Bollinger Bands, where the current %B stands at 119%, indicating that the price has surged outside the upper band of 71.40. While this typically signals a stretched condition, in a strong momentum environment, it can also signify the beginning of a powerful expansion phase.
Oscillators and Momentum
Despite the bullish trend, caution is warranted beneath the surface. The RSI(14) at 83.6 firmly places DBS in overbought territory. This is corroborated by the Stochastic %K at 97.2 and %D at 99.0, which are also deep in the overbought zone, suggesting that the recent velocity of the move may be unsustainable in the immediate term without a period of consolidation.
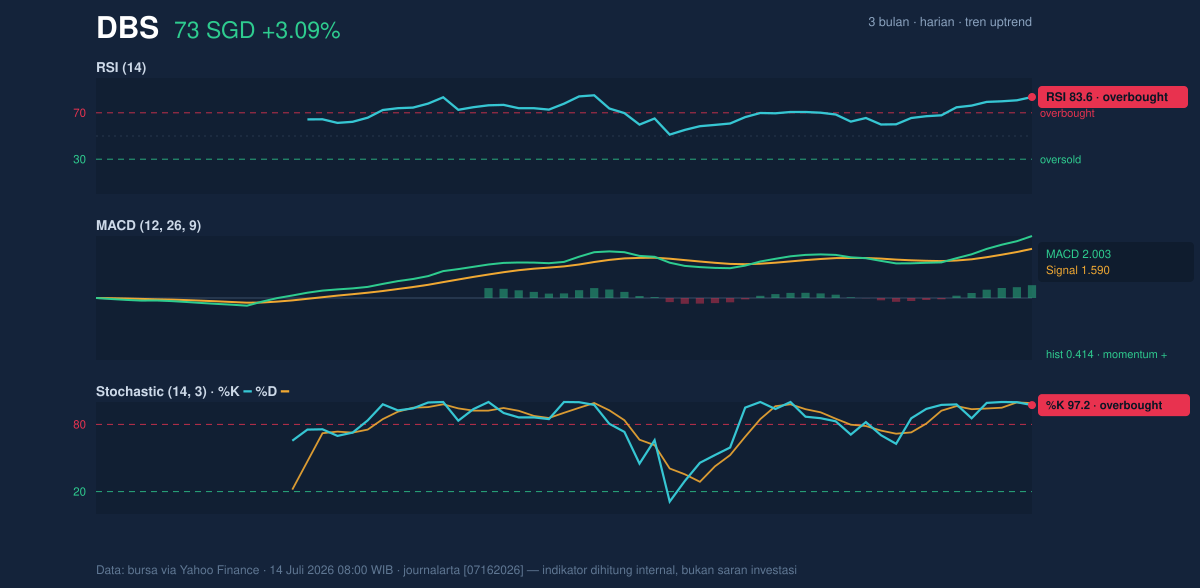
However, the MACD remains a source of strength, with a value of 2.003 above the signal line of 1.590 and a positive histogram of 0.414. This confirms that the primary momentum remains upward; the "divergence" between the overbought oscillators and the MACD suggests that while the stock is prone to a technical pullback, the underlying trend is far from exhausted.
Volatility and Volume
Trading activity is supporting the price action. With a volume of 4,787,100, the stock is trading at 1.1x the 20-day average, confirming that institutional participation is fueling the breakout. The On-Balance Volume (OBV) is rising, a critical signal that money is actively flowing into the stock during this climb. Meanwhile, the ATR(14) of 0.98 indicates that despite the sharp price increase, the volatility remains relatively contained at 1.3% of the share price, implying that the move is structured and deliberate rather than panic-induced.
Key Levels and Scenarios
The stock has successfully breached the previous resistance of 72.03. With this barrier now cleared, it serves as the new primary support level. Should the price sustain this breakout, the absence of historical resistance overhead allows for potential discovery of new price floors. Conversely, a failure to hold 72.03 would signal a potential "mean reversion"—a return to the mean—that could invite sellers to test the proximity of the SMA20 at 67.27.
Technical Verdict: HOLD (wait & see)
The current technical setup suggests that while DBS is exhibiting superior strength, the extreme readings in the RSI and Stochastic create an elevated risk of a short-term cooling-off period. Buying into an overextended move carries a higher risk of immediate drawdown.
* Entry Range: 69.50 – 70.50 SGD (Seeking a retest of the breakout point)
* Exit Target: 75.00 SGD (Projected expansion target)
* Stop Loss: 67.20 SGD (Below the SMA20 to invalidate the current momentum)
This verdict is invalidated if the price falls below the 65.01 support level, which would signal a breakdown of the current structural uptrend.
Market observers note that DBS is currently "pricing in a future that is expanding faster than the historical averages," suggesting that those holding positions may want to see if the stock can consolidate above its former resistance before adding exposure.
***
*Disclaimer: This analysis is for informational purposes only and does not constitute financial advice. All trading involves risk; please consult with a certified financial advisor before making investment decisions.*
Summary Data DBS
| Last price | 72.98 SGD |
| Change 1 day / 5 days / 1 month | 3.09% / 6.32% / 14.51% |
| Trend / MA-cross | uptrend / none |
| SMA20 / SMA50 | 67.27 / 63.93 |
| RSI (14) / Stochastic %K | 83.6 / 97.2 |
| Bollinger %B / ATR | 119% / 0.98 |
| Support / Resistance 20 days | 65.01 / 72.03 |
| Data as of | 14 Juli 2026 08:00 WIB |
Track DBS share price daily: live levels, support/resistance and our full DBS analysis history.



