HSBC Stock Gains 1.22% Today, Testing Key Resistance
On Juli 16, 2026: price 1,479.80 GBp, trend uptrend, RSI 66.2, support 1,422.60, resistance 1,490.00. technical analysis of hsbc stock.
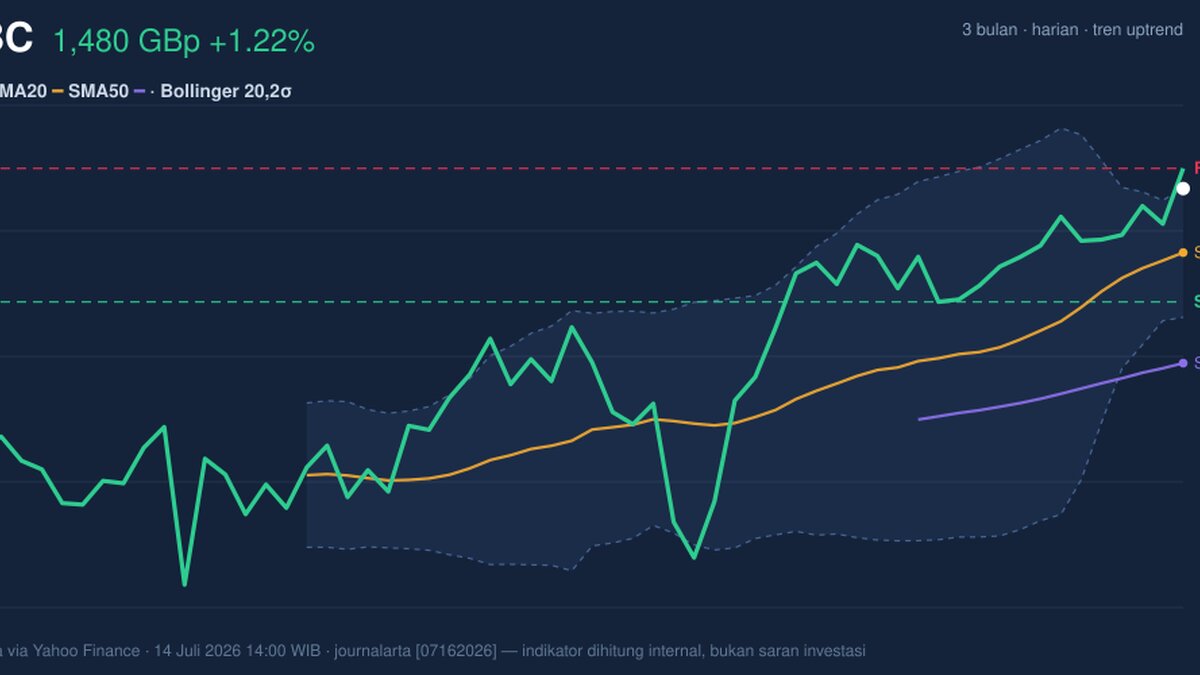
HSBC Holdings (HSBA.L) traded at 1,479.80 GBp on July 14, 2026, marking a 1.22% daily gain and continuing a steady 4.98% ascent over the past month. This price action places the stock firmly above both the SMA20 of 1,447.46 and the SMA50 of 1,391.67, confirming a resilient uptrend. For investors, this positioning signals that the medium-term momentum remains squarely in the hands of the buyers, as the stock consistently establishes higher floors in its recovery from the three-month low of 1,256.20 GBp.
Trend and Price Structure
The stock’s current trajectory is defined by a slope of 1.94% over the last five days on the SMA20, reflecting a controlled, deliberate climb. By maintaining its position above the moving averages, HSBC has avoided the structural damage associated with trend reversals, keeping the focus on the path toward the three-month high of 1,590.00 GBp.
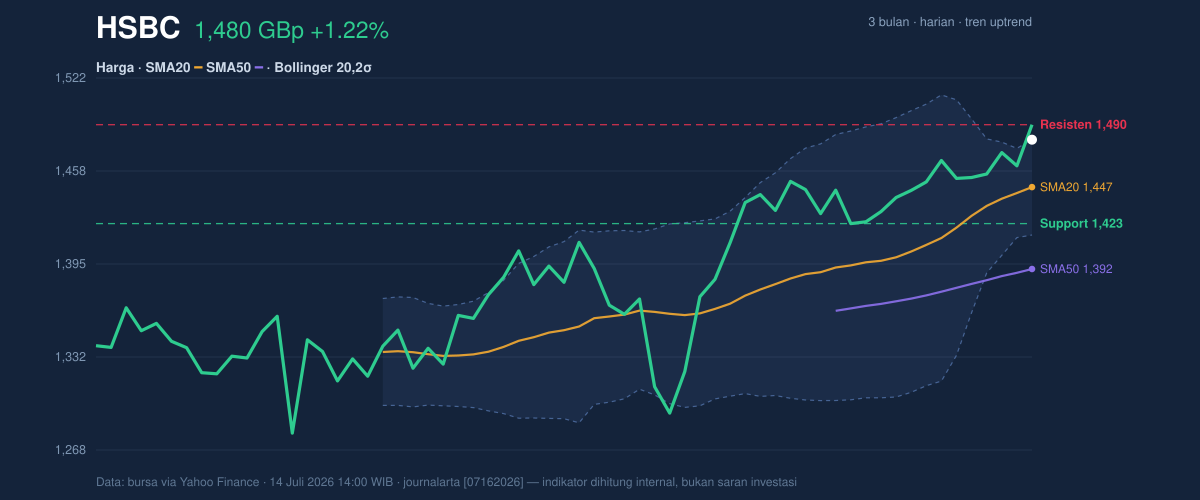
The price is currently testing the outer limits of its range, sitting at 85% between the 20-day support of 1,422.60 GBp and the resistance of 1,490.00 GBp. With the price hovering near the Bollinger upper band of 1,480.08 GBp, the market is approaching a zone where selling pressure historically intensifies.
Oscillators and Momentum
Momentum signals present a nuanced picture. The RSI at 66.2 remains in neutral territory, suggesting that while the stock is trending upward, it is not yet in "overbought" conditions that typically precede an exhausted rally. The MACD is positive at 23.064 with the signal line at 21.662, and the widening histogram confirms that the bullish pressure is actively accumulating.
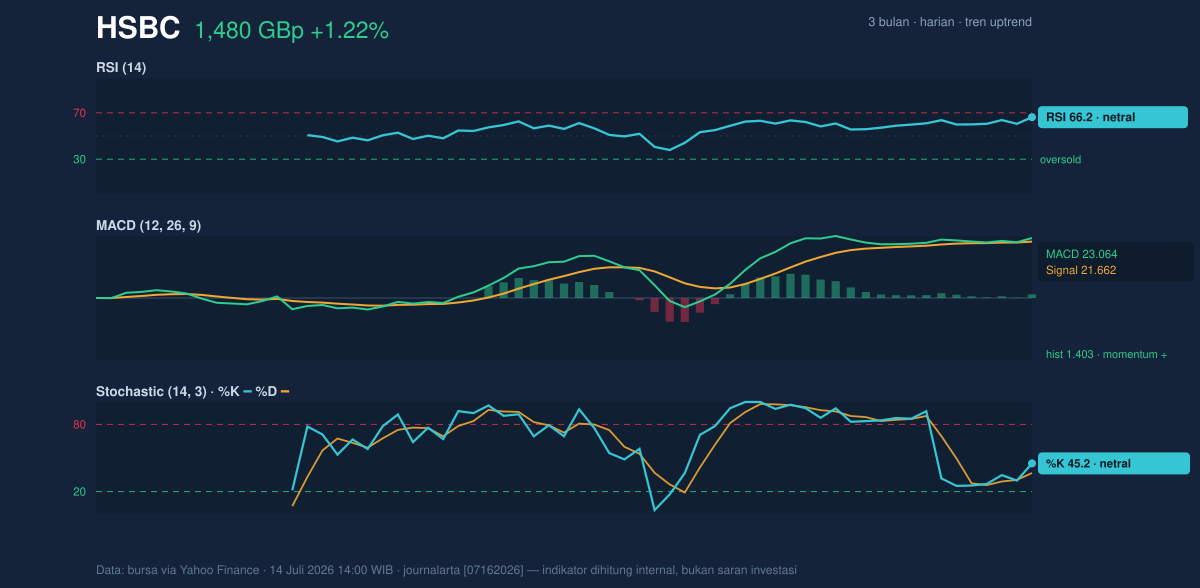
The Stochastic %K of 45.2 indicates that the stock has ample room to move higher before momentum becomes stretched. This lack of divergence between price and the MACD is a vital signal that the current rally is supported by genuine market participation rather than speculative spikes.
Volatility and Volume
Trading volume, currently at 20,547,778, sits at roughly 0.9 times the 20-day average. While volume is slightly below the long-term norm, the On-Balance Volume (OBV) trend is rising, suggesting that participants are accumulating shares rather than liquidating them. Furthermore, the Bollinger Band width is narrow at 4.5%, indicating a squeeze. This compression is a classic technical precursor to a volatile breakout; once the price clears the upper band, the ATR of 36.15 suggests significant room for expansion.
Technical Verdict: HOLD (wait & see)
The current market posture for HSBC is one of consolidation near resistance. While the trend is undeniably healthy, the proximity to the 1,490.00 GBp resistance warrants caution before committing new capital.
* Entry Range: 1,440.00 – 1,450.00 GBp (targeting a pullback toward the SMA20)
* Exit Target (Resistance): 1,490.00 – 1,500.00 GBp
* Stop Loss: 1,420.00 GBp
The verdict is invalidated if the price falls below 1,422.60 GBp, which would signal a breakdown of the current upward structure and suggest a deeper correction toward the SMA50.
For those watching from the sidelines, the market is currently waiting for a decisive push through the 1,490.00 GBp ceiling to confirm the next leg of the move.
The exchange reported that the company is scheduled for its next interim dividend declaration process within the coming quarter.
Summary Data HSBC
| Last price | 1,479.80 GBp |
| Change 1 day / 5 days / 1 month | 1.22% / 1.82% / 4.98% |
| Trend / MA-cross | uptrend / none |
| SMA20 / SMA50 | 1,447.46 / 1,391.67 |
| RSI (14) / Stochastic %K | 66.2 / 45.2 |
| Bollinger %B / ATR | 100% / 36.15 |
| Support / Resistance 20 days | 1,422.60 / 1,490.00 |
| Data as of | 14 Juli 2026 14:00 WIB |
Track HSBC share price daily: live levels, support/resistance and our full HSBC analysis history.