HSBC Stock Analysis: Gains 3.19%, RSI Overbought
On Juli 24, 2026: price 161.50 HKD, trend uptrend, RSI 70.6, support 147.60, resistance 158.90. technical analysis of hsbc stock. HSBC Stock Analysis — full…
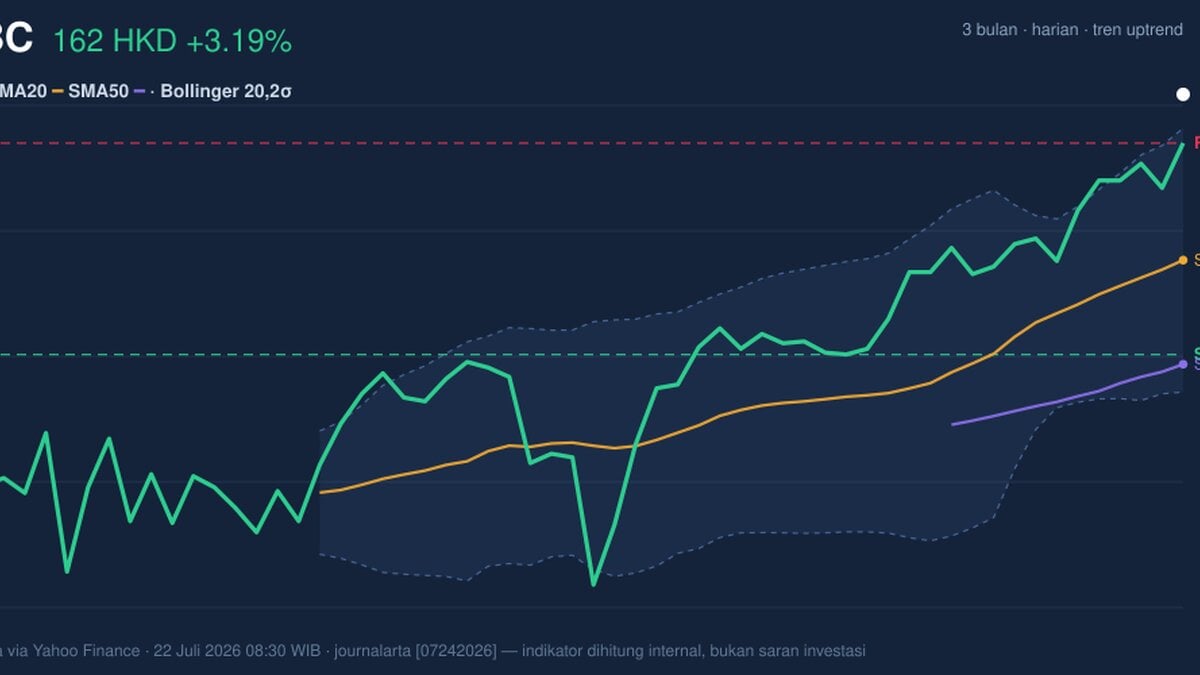
At HK$161.50, HSBC Holdings is trading above its recent ceiling, with the share price now sitting above the 20-day Bollinger upper band at HK$159.70 and well clear of the 20-day support at HK$147.60. That move matters because it shows buyers have not only defended the uptrend, they have pushed the stock into a zone where price is running hotter than its recent statistical range — a sign of strength, but also of short-term exhaustion risk. The stock is up 3.19% on the day, 3.99% over five days and 8.61% over one month, a sequence that points to persistent demand rather than a one-off spike.
Trend & Price Action
The broader structure is still constructive. HSBC is trading above the SMA20 at HK$152.64 and above the SMA50 at HK$147.08, which means the shorter-term average price remains above the medium-term average and price itself is above both — a classic sign that the trend is intact. The SMA20 slope of 1.58% over five days reinforces that the trend is rising, not flattening. There is no fresh MA cross, so the message from moving averages is not a new acceleration signal but rather an existing uptrend that is still being respected. As shown in the chart, the stock is also above the 20-day resistance at HK$158.90 and trading at 123% of the 20-day range, which tells readers the market is pressing into territory beyond the recent trading band.
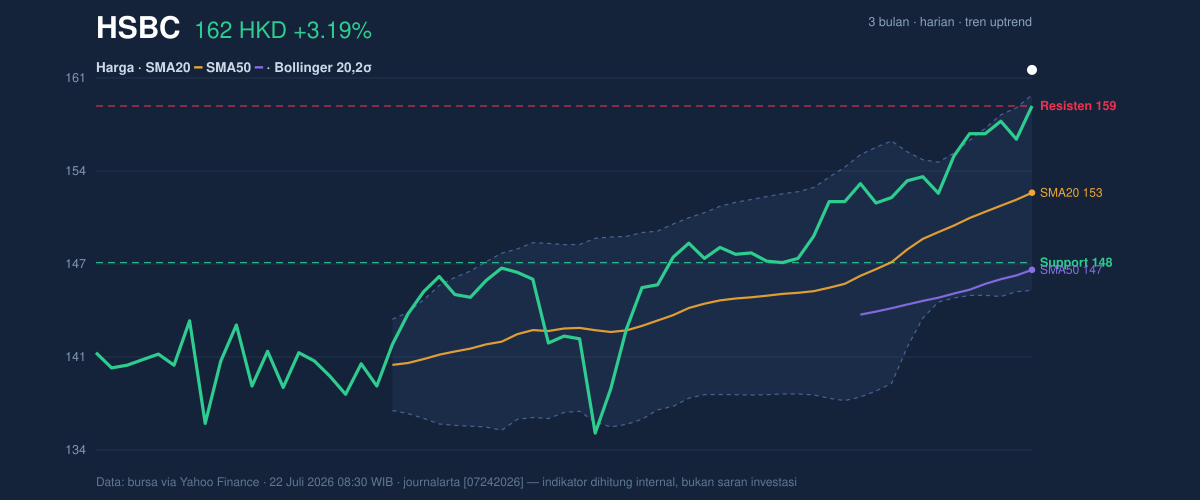
That last point is important: when price sits beyond the upper part of its range, it often reflects momentum chasing strength, but it can also leave less room for immediate follow-through without a pause. The 3-month high of HK$158.90 has already been exceeded, so the chart is no longer dealing with a capped range; it is in price discovery for this lookback window.
Oscillators & Momentum
The momentum picture is stronger than the trend picture, but also more stretched. The RSI at 70.6 is in overbought territory, which does not mean reversal is guaranteed; it means the stock has risen fast enough that further gains may require fresh buying to keep pace. The Stochastic %K at 100.0 and %D at 92.8 are also overbought, showing the close is near the top of the recent range and that short-term momentum is fully extended. Yet the MACD at 3.142, above its signal line at 2.770, with a positive histogram of 0.372, says the trend momentum is still expanding rather than fading.
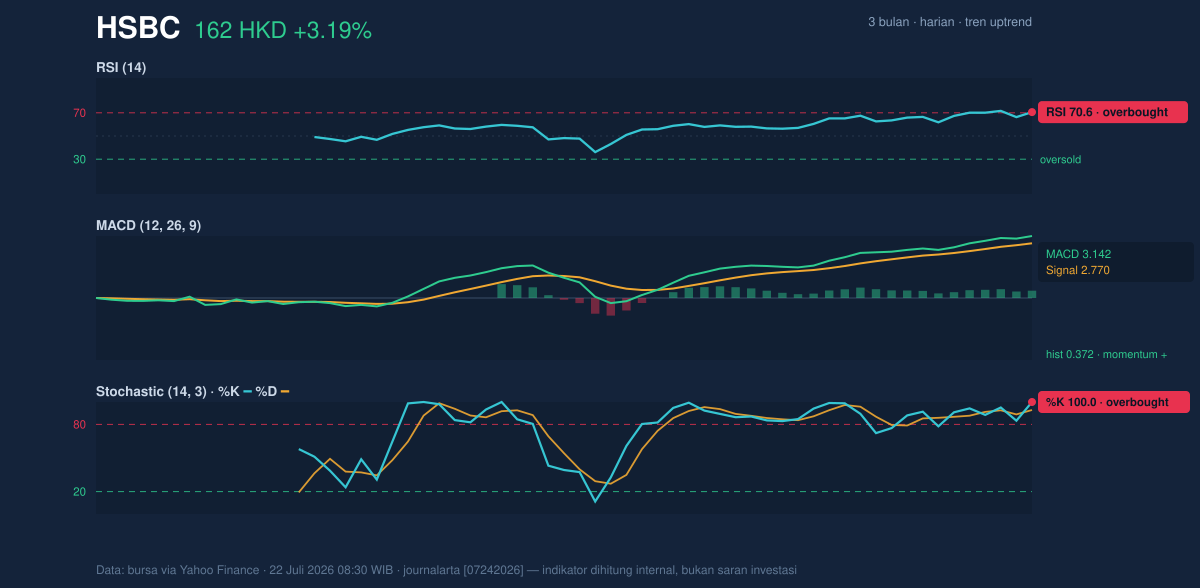
This mix is often the most revealing part of the chart: overbought oscillators warn the move is mature, while MACD says the advance still has internal confirmation. In plain terms, the stock is not weak — it is just no longer cheap on momentum grounds.
Volatility & Volume
Volatility is not flashing panic. The ATR(14) at 2.64, equal to 1.6% of price, suggests daily swings are moderate rather than extreme. The Bollinger band width of 9.2% is described as normal, which means this is not a squeeze setup waiting for a major volatility burst; instead, the market is already moving within a fairly standard envelope. The key nuance is that price is now above the upper Bollinger band at HK$159.70, with %B at 113%, a reading that shows the stock has pushed beyond the upper statistical boundary. That is a strong trend signal, but also a reminder that prices often cool after such extensions.
Volume supports the move, though not dramatically. Last volume was 14,270,934, versus a 20-day average of 13,527,408, or 1.1× normal. That is enough to confirm participation without suggesting euphoric turnover. The OBV is rising, which is a useful confirmation because it means volume has been accumulating alongside price, rather than diverging from it. In other words, the advance is being backed by buyers, not just by thin trading.
Key Levels & Scenarios
The chart levels are now straightforward. Immediate support sits at HK$158.90, which is also the 3-month high and the former resistance zone. If the stock can hold above that area, the breakout remains technically valid and the market may continue to treat that level as a floor. Below that, the next reference is the SMA20 at HK$152.64, then the 20-day support at HK$147.60, which is the more important line for trend health. On the upside, the market has already cleared the near-term ceiling at HK$159.70, so any continuation would need to stay above that band to keep the breakout narrative intact.
The signal to watch is not simply whether HSBC is rising, but whether it can keep rising without losing the newly broken levels. A hold above HK$158.90 would keep the chart aligned with the trend; a fall back through that area would suggest the market is rejecting the breakout and reverting to the prior range.
Technical Verdict: HOLD (wait & see)
- Reason 1: The trend remains positive, with price above the SMA20 at HK$152.64 and above the SMA50 at HK$147.08, while the SMA20 slope is rising.
- Reason 2: Momentum is strong but stretched: RSI 70.6 and Stochastic %K 100.0 / %D 92.8 are overbought, even as MACD stays above signal with a positive histogram.
- Reason 3: Price is above the upper Bollinger band at HK$159.70 and %B is 113%, which confirms strength but also raises the odds of a pause or pullback.
- Invalidation: This verdict is invalidated if price falls below HK$147.60.
- Ideal Entry Range: HK$158.90 to HK$159.70
- Exit Target: HK$161.50 and, if momentum persists, above that only while holding the breakout zone
- Stop Loss protection: HK$152.64, with deeper protection at HK$147.60
In plain English: HSBC is still trending higher, but the stock is already stretched enough that the chart is asking for confirmation rather than chase.
Latest hard fact: volume was 14,270,934 shares versus a 20-day average of 13,527,408.
Summary Data HSBC
| Last price | 161.50 HKD |
| Change 1 day / 5 days / 1 month | 3.19% / 3.99% / 8.61% |
| Trend / MA-cross | uptrend / none |
| SMA20 / SMA50 | 152.64 / 147.08 |
| RSI (14) / Stochastic %K | 70.6 / 100.0 |
| Bollinger %B / ATR | 113% / 2.64 |
| Support / Resistance 20 days | 147.60 / 158.90 |
| Data as of | 22 Juli 2026 08:30 WIB |
Track HSBC share price daily: live levels, support/resistance and our full HSBC analysis history.