AIA Group closed at HKD 77.95, down 0.83% from the previous close of 78.60, but the bigger signal is that the shares are sitting above SMA20 at 74.32 and just under the 20-day resistance at 78.60. That places the stock near the top of its recent trading range, with the chart showing a market that is still constructive, yet no longer cheap on short-term momentum.
Trend & Price Action
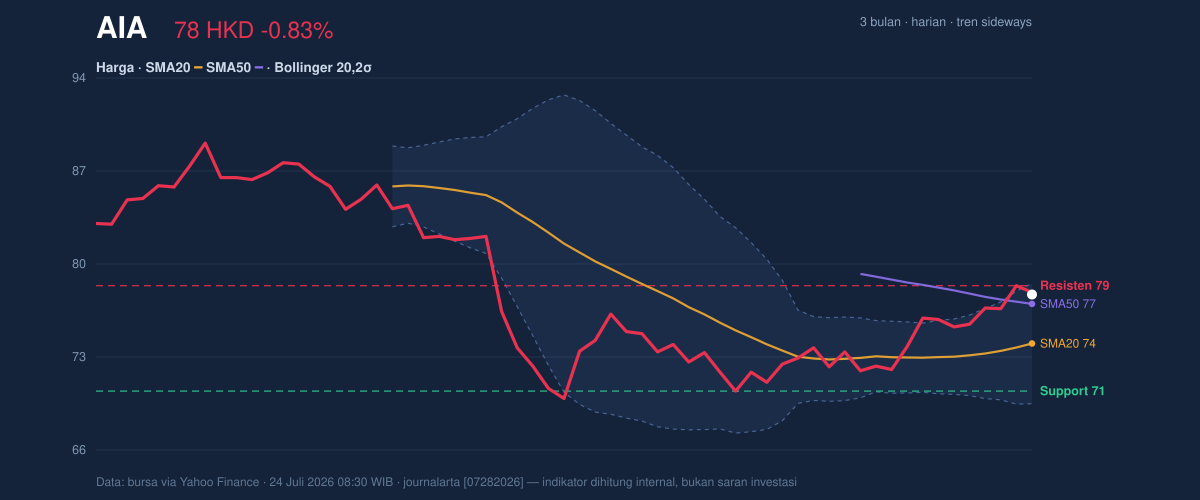
AIA’s broader pattern remains sideways, and that matters because sideways trends often reflect a market waiting for a clearer catalyst rather than one already committed to a sustained breakout or breakdown. The SMA20 is rising by 1.33% over 5 days, which tells us short-term trend pressure has improved, even though the stock has not yet made a decisive move beyond the recent ceiling. With price above SMA20 but still close to SMA50 at 77.25, the shares are effectively straddling a pivot zone where buyers have support, but sellers are still active near the highs.
3-month price action chart of AIA: price, SMA20/50, Bollinger, support & resistance. Data: exchange via Yahoo Finance.
The position is also telling from a range perspective. At 77.95, the stock is at roughly 92% of its 20-hour range, which signals strength, but also means there is limited room before the chart tests resistance again. The 3-month high at 89.95 and 3-month low at 69.05 frame the bigger picture: AIA has recovered meaningfully from the lower end of that band, but it has not yet reclaimed the upper part of the range. In plain terms, the market has repaired the chart, not completed the recovery.
Oscillators & Momentum
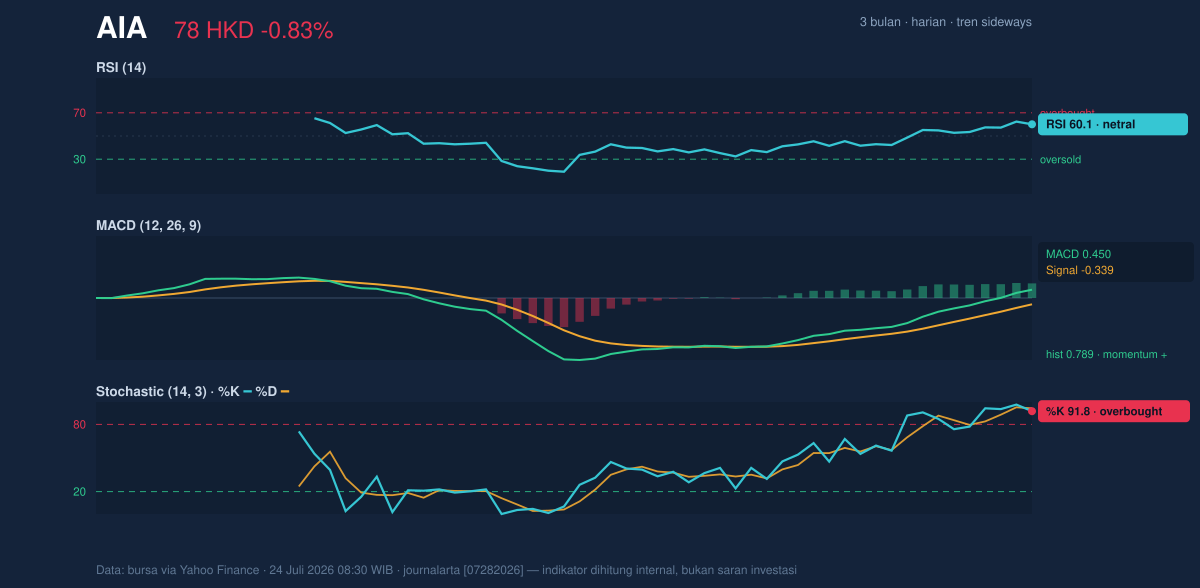
The momentum picture is mixed, and that mix is important. RSI at 60.1 is still neutral, which means the stock is not technically stretched on the broad momentum gauge. But the Stochastic %K at 91.8 and %D at 94.4 are both in overbought territory, indicating the recent advance may be running ahead of itself in the very short term. That combination often appears when price is strong, but the immediate upside is becoming harder to sustain without a pause.
Momentum chart of AIA: RSI(14), MACD, Stochastic. Data: exchange via Yahoo Finance.
The MACD at 0.450 versus a signal line at -0.339, with a histogram of 0.789, points in the opposite direction: underlying momentum is still positive and improving. In practical terms, MACD is saying the trend has enough force to stay alive, while Stochastic is warning that the move may need to cool before extending further. That is not a contradiction; it is a common setup when a stock is trending upward but has become short-term extended.
Volatility & Volume
Volatility is not spiking. The Bollinger Bands are in a normal 12.0% width, and ATR(14) at 2.00 equals about 2.6% of price, which suggests movement is active but not disorderly. The %B at 91% is the more important clue: it means price is pressing near the upper band, a sign of strength, but also a sign that the stock is trading in the upper edge of its recent statistical envelope. When a name sits this close to the top band, the market is usually pricing in momentum already.
Volume, however, is less convincing. Last session’s turnover of 22,838,041 was below the 20-session average of 26,468,756, or about 0.9× normal. That matters because a move toward resistance is more convincing when participation expands. Here, the stock is advancing without clear volume confirmation, and OBV is falling, which suggests the balance of accumulated volume has not fully endorsed the recent price strength. In other words, the chart is rising, but the money flow is not yet giving a clean green light.
Key Levels & Scenarios
The near-term map is clear. Resistance at 78.60 is the first line that matters, because it matches the previous close and the top of the 20-hour range. A sustained move above that area would put the Bollinger upper band at 78.77 into focus as the next technical ceiling. On the downside, support at 70.80 is the key floor from the 20-hour range, while SMA20 at 74.32 and SMA50 at 77.25 form a layered support zone beneath the current price.
If the stock clears 78.60 with better participation, the chart would shift from range-bound strength to a more convincing breakout attempt. If it fails to hold 74.32, the short-term tone weakens quickly because the price would lose the average that has been guiding the recent rebound. A break below 70.80 would be more serious, as it would expose the lower end of the recent 3-month range near 69.05.
Technical Verdict: HOLD (wait & see)
HOLD (wait & see) fits the current setup best because the chart is constructive, but not fully confirmed.
- MACD is positive and the histogram is strong, which supports the underlying trend.
- Stochastic is overbought, so short-term upside may be stretched even though the broader move remains intact.
- Volume is below average and OBV is falling, which weakens confirmation near resistance.
Verdict invalidated if price breaks below 70.80, because that would damage the recent range structure and shift attention toward the lower end of the 3-month band.
- Ideal Entry Range: 74.32 to 77.25
- Exit Target: 78.60 to 78.77
- Stop Loss protection: below 70.80
For non-traders, this means the stock looks healthy enough to watch, but it has not yet proven it can move cleanly beyond resistance.