HSBC Stock Drops 2.91%, Momentum Gains In Focus
On September 11, 2026: price 1,529.00 GBp, trend sideways, RSI 54.8, support 1,497.20, resistance 1,580.20. technical analysis of hsbc stock.
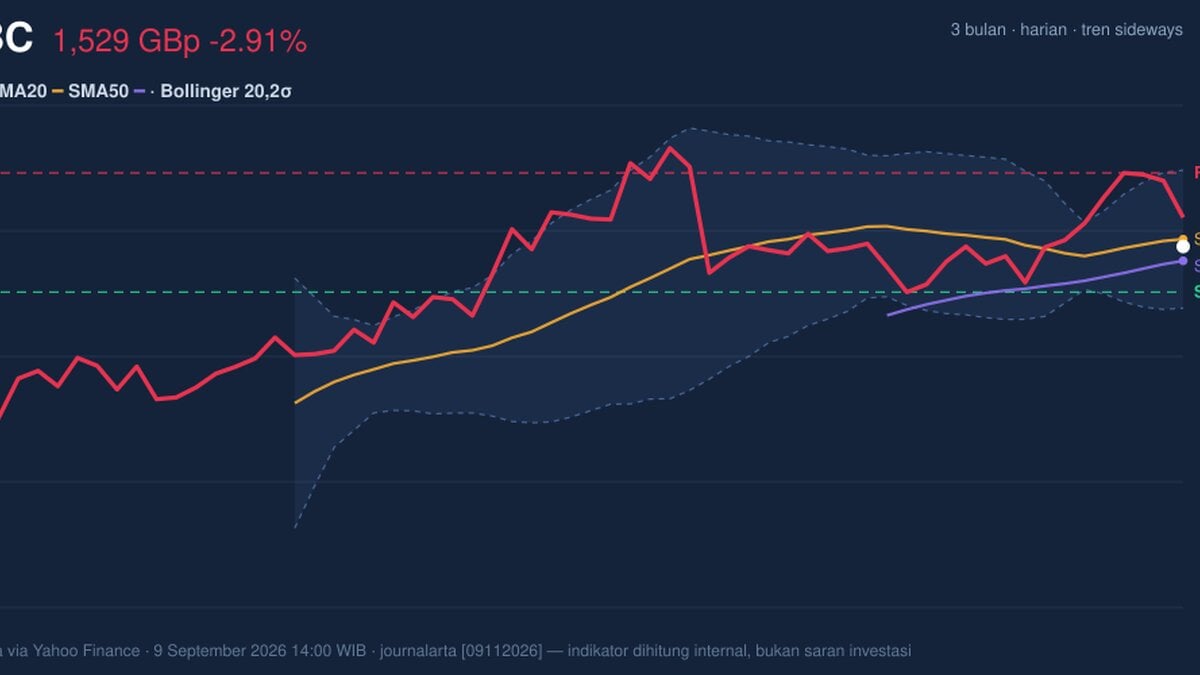
HSBC Holdings’ LSE shares finished at 1,529.00 GBp on 9 September 2026, slipping 2.91% on the day after a mild 0.31% gain over the past month. The move leaves the stock just under its SMA20 at 1,534.06 and still above its SMA50 at 1,519.02, a setup that points to a market that is not trending cleanly in either direction but is instead testing whether recent softness is only a pause or the start of a deeper pullback. As shown in the chart, the price is sitting near the middle of its short-term range rather than pressing into either extreme.
Trend & Price Action
The broader message from the chart is one of consolidation rather than collapse. HSBC is in a sideways trend, and the SMA20 slope of 0.77% over 5 days suggests the short-term trend is still gently rising even though the latest close landed below the SMA20. That matters because a close under the 20-day average often signals that momentum has cooled, but the fact that the share price remains above the SMA50 means the medium-term structure has not broken down. In plain terms, the stock is drifting, not decisively reversing.
The Bollinger Bands sharpen that picture. The price sits near the 1,534.06 middle band with %B at 45%, which means it is neither stretched toward the upper band nor pressed against the lower band. The 6.3% band width is relatively tight and is described as a squeeze, a condition that often precedes a larger move once price escapes the range. That does not predict direction on its own; it means the market is storing potential energy.

The immediate map is clear: 1,497.20 is the near-term support that has to hold to keep the range intact, while 1,580.20 is the first resistance that needs to be reclaimed before the stock can show more convincing upside traction. The share price is currently positioned at about 38% of its 20-hour range, which places it closer to the lower half of that corridor but not yet at a breakdown point.
Oscillators & Momentum
Momentum is more constructive than the price action alone might suggest. The RSI at 54.8 is neutral, which usually means there is no strong overbought or oversold pressure forcing an imminent reversal. That neutrality is important: it tells readers the market is not emotionally extended. The Stochastic %K at 60.2 and %D at 80.7 also sit in a neutral-to-firmer zone, but the gap between the two lines hints that short-term momentum has eased from its earlier strength.
The more telling signal comes from MACD. With MACD at 13.983, above the signal line at 10.946, and a positive histogram of 3.037, the indicator is still pointing to upward momentum underneath the surface. That means recent price weakness has not yet been confirmed by momentum tools as a full bearish turn. In technical terms, the stock is losing altitude, but the engine is still running.

This mix matters because it creates a tension between price and momentum: the shares are trading a touch softer than their short-term average, yet the oscillator set has not rolled over decisively. When momentum stays positive while price hovers near support, traders often watch for either a rebound back toward the upper band or a failure that forces a sharper reset.
Volatility & Volume
Volatility is moderate, not wild. The ATR(14) at 26.84, equal to 1.8% of price, suggests HSBC can move enough in a day to matter, but not with the kind of instability that would usually accompany panic. Combined with the narrow Bollinger Band width, this points to a coiled setup: the stock is not especially volatile right now, but it may not stay quiet for long.
Volume adds a cautionary note. The latest turnover of 12,135,883 was only 0.6× normal versus the 20-session average of 19,802,767. That means the recent dip was not accompanied by strong participation, which weakens the case for aggressive downside conviction. At the same time, OBV is rising, and that is a subtle but useful clue: on balance, more volume has been accumulating on up days than on down days, which can support the idea that underlying demand has not disappeared.
In other words, the tape is soft, but not heavily sold.
Key Levels & Scenarios
The next move is likely to be judged by how HSBC behaves around the current band of support and resistance. A hold above 1,497.20 would preserve the short-term range and keep the focus on a potential rebound toward 1,580.20. If the stock can clear that resistance, the chart would begin to look less like consolidation and more like an attempt to revisit the upper part of its recent three-month structure.
That three-month structure matters: the stock has traded between a 3-month high of 1,610.00 and a 3-month low of 1,267.20. So even after the recent pullback, HSBC is still much closer to the top of that range than the bottom, which suggests the longer backdrop remains comparatively firm. The risk is that a failure to defend the lower boundary of the short-term range could invite a faster move toward the lower Bollinger Band at 1,486.04.
Key levels to watch: 1,497.20 support, 1,580.20 resistance, 1,534.06 SMA20, 1,519.02 SMA50, and 1,486.04 lower Bollinger Band.
Technical Verdict: HOLD (wait & see)
HOLD (wait & see) fits the chart best because the signals are mixed rather than aligned. MACD remains positive, OBV is rising, and the stock is still above the SMA50, which argues against a bearish breakdown. But the price is also below the SMA20, RSI is neutral, and volume on the latest decline was only 0.6× normal, so there is not enough confirmation for a clean directional call. The Bollinger squeeze adds a further reason to wait: compressed bands often precede a move, but not before the market chooses a direction.
- Ideal Entry Range: 1,497.20 to 1,534.06
- Exit Target: 1,580.20
- Stop Loss protection: 1,486.04 or a decisive break below 1,497.20
- Verdict invalidated if price falls below 1,497.20, as that would weaken the current range and expose the lower Bollinger area
For non-traders, that means HSBC is sitting in a tight technical range where the next decisive move has not yet been confirmed.
The latest 3-month high is 1,610.00.
Summary Data HSBC
| Last price | 1,529.00 GBp |
| Change 1 day / 5 days / 1 month | -2.91% / -1.05% / 0.31% |
| Trend / MA-cross | sideways / none |
| SMA20 / SMA50 | 1,534.06 / 1,519.02 |
| RSI (14) / Stochastic %K | 54.8 / 60.2 |
| Bollinger %B / ATR | 45% / 26.84 |
| Support / Resistance 20 days | 1,497.20 / 1,580.20 |
| Data as of | 9 September 2026 14:00 WIB |
Track HSBC share price daily: live levels, support/resistance and our full HSBC analysis history.