AstraZeneca Stock Drops 0.99%, Momentum Gains In Focus
On September 11, 2026: price 11,758.00 GBp, trend sideways, RSI 39.2, support 11,460.00, resistance 12,476.00. technical analysis of astrazeneca stock.
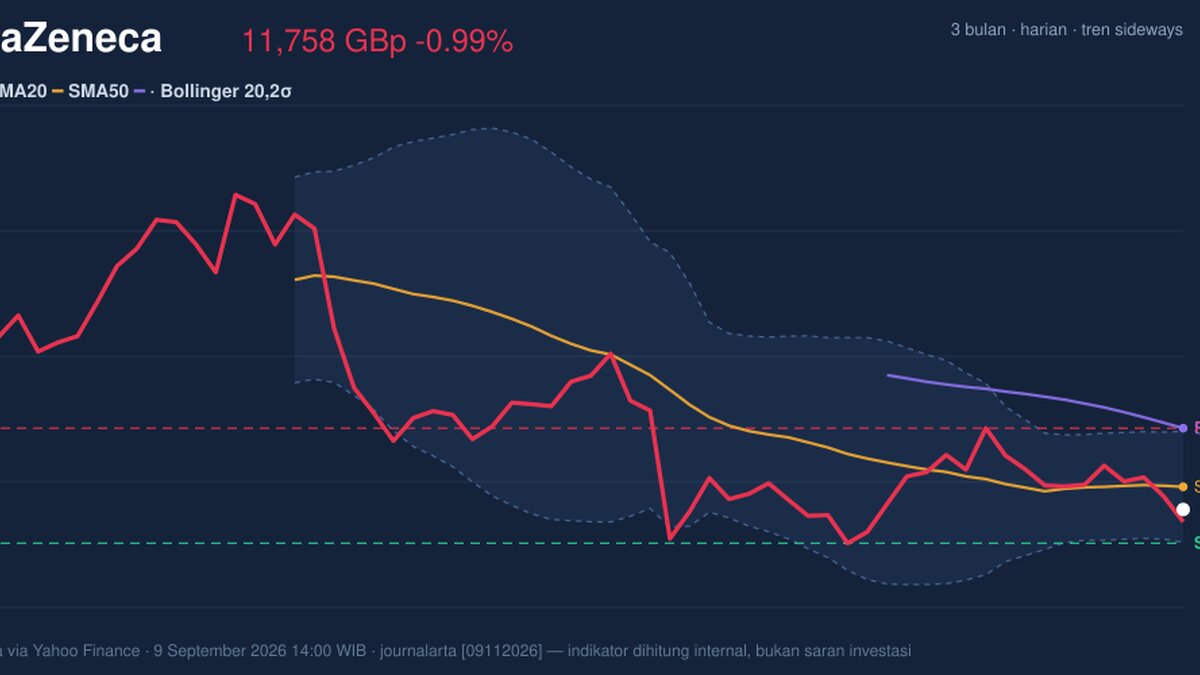
AstraZeneca shares on the LSE slipped to 11,758.00 GBp by 14:00 WIB on 9 September 2026, down 0.99% on the day, as the stock continued to trade below its short- and medium-term averages. That move matters because it leaves the shares in a technically fragile part of the range: not collapsing, but still unable to reclaim the levels that would usually signal that buyers are back in control.
Trend & Price Action
The broader pattern remains sideways, but it is a weak sideways phase rather than a healthy consolidation. The key tell is that price is sitting below SMA20 at 11,958.80 and well below SMA50 at 12,475.60. In plain terms, the short-term trend has slipped under the recent average, while the longer average still sits overhead like a ceiling. That structure often means rallies are being sold into before they can develop into a stronger move.
The chart also shows no fresh MA-cross, which is important. A new moving-average crossover often acts as a clean trend signal; its absence here suggests the market has not yet committed to a new direction. Instead, AstraZeneca is drifting in the lower half of its recent band, with price positioned at about 29% of the 20-hour range. That placement is usually a sign that the stock is closer to support than resistance, but it is not the same as a confirmed bounce.

The immediate map is clear. Support at 11,460.00 is close enough to matter, while resistance at 12,476.00 lines up almost exactly with the SMA50 at 12,475.60. When a resistance level and a moving average overlap, the area tends to become more meaningful because it represents both prior supply and a technical benchmark. A move through that zone would say more than a simple one-day rebound; it would suggest the stock is beginning to rebuild structure.
Oscillators & Momentum
The momentum picture is more constructive than the trend picture. RSI at 39.2 is still neutral, but it is leaning toward the lower end of the range, which tells us the stock is not overextended on the downside. That matters because a weak trend with a low-but-not-extreme RSI can sometimes set up a rebound if selling pressure fades.
The more interesting signal comes from stochastic. Stochastic %K at 5.9 versus %D at 28.8 shows the stock in oversold territory. For general readers, stochastic compares the current price with its recent range; when it drops this low, it often means the stock has moved quickly enough that it may be due for a pause or bounce. It does not guarantee reversal, but it does show that near-term downside momentum is stretched.

MACD adds another layer. The line is still negative at -129.872, which means the broader momentum trend has not fully turned positive. But the MACD histogram at 6.601 is positive, and MACD sits above its signal line, with the signal at -136.473. That combination is often read as improving momentum beneath a still-soft trend. In simple terms, the stock is not yet strong, but the rate of decline appears to be easing. That is a better setup than a straight-line selloff.
Volatility & Volume
Volatility is not screaming at the market. ATR at 299.74, or 2.5% of price, points to moderate volatility. ATR, or average true range, is a gauge of how much the stock typically moves in a day; a reading like this suggests the shares can still swing, but not in a disorderly way. That leaves room for a rebound or a break, but not the kind of explosive move that usually comes with a volatility spike.
Bollinger Bands reinforce that muted tone. Price is trading with %B at 30%, which places it in the lower part of the band structure but not at the extreme edge. The bands are relatively contained, with a normal 8.2% width. That is important because a squeeze can hint at an approaching expansion, but this is not yet a classic squeeze setup. The message is more restrained: the stock is leaning low in its range, but volatility has not compressed enough to promise a sharp move.
Volume is offering partial confirmation, though not a decisive one. Last volume was 3,566,251, about 1.3× the 20-hour average of 2,804,371. Higher-than-average volume on a down day can mean sellers still have the upper hand, but it can also mark active repositioning near support. The caution flag is OBV, which is down. OBV, or on-balance volume, tracks whether volume is flowing in a direction that supports price. A falling OBV suggests that, despite the heavier turnover, money flow has not yet turned convincingly positive.
Key Levels & Scenarios
The key battle is between 11,460.00 support and 12,476.00 resistance. If price holds above support and momentum improves, the first test is whether the stock can move back through SMA20 at 11,958.80. That would signal that the market is at least recovering its short-term average, which often helps stabilize sentiment. A stronger recovery would require a push into the 12,448.93 upper Bollinger band and then the 12,476.00 resistance zone.
If 11,460.00 fails, the chart loses its nearest floor and the stock would likely shift into a weaker technical posture. That would also make the current oversold readings less useful as a bounce signal, because oversold conditions can remain in place during a deeper down move. On the upside, a move through 12,476.00 would be the clearest sign that sellers are losing control, especially since it would also place price back above the long-standing moving-average barrier.
Technical Verdict: HOLD (wait & see)
- Reason 1: Price is still below SMA20 at 11,958.80 and below SMA50 at 12,475.60, so the trend has not repaired.
- Reason 2: Stochastic is oversold and MACD histogram is positive, which argues for improving momentum, but not yet a confirmed reversal.
- Reason 3: Volume is 1.3× normal while OBV is down, a mix that shows participation but not clear accumulation.
- Verdict invalidated if price breaks below 11,460.00, because that would remove the nearest support and weaken the bounce case.
- Ideal Entry Range: 11,460.00 to 11,958.80
- Exit Target (Target Price): 12,448.93 to 12,476.00
- Stop Loss protection: below 11,460.00
For non-traders, this means the shares are not showing a clean recovery yet, but they are close enough to support that the next move could matter.
3-month high: 15,126.00; 3-month low: 9,892.00.
Summary Data AstraZeneca
| Last price | 11,758.00 GBp |
| Change 1 day / 5 days / 1 month | -0.99% / -1.82% / -0.73% |
| Trend / MA-cross | sideways / none |
| SMA20 / SMA50 | 11,958.80 / 12,475.60 |
| RSI (14) / Stochastic %K | 39.2 / 5.9 |
| Bollinger %B / ATR | 30% / 299.74 |
| Support / Resistance 20 days | 11,460.00 / 12,476.00 |
| Data as of | 9 September 2026 14:00 WIB |
Track AstraZeneca share price daily: live levels, support/resistance and our full AstraZeneca analysis history.