Testing Key Resistance, Shell Stock Gains 0.93% Today
On September 11, 2026: price 3,533.00 GBp, trend uptrend, RSI 65.6, support 3,288.00, resistance 3,504.00. technical analysis of shell stock.
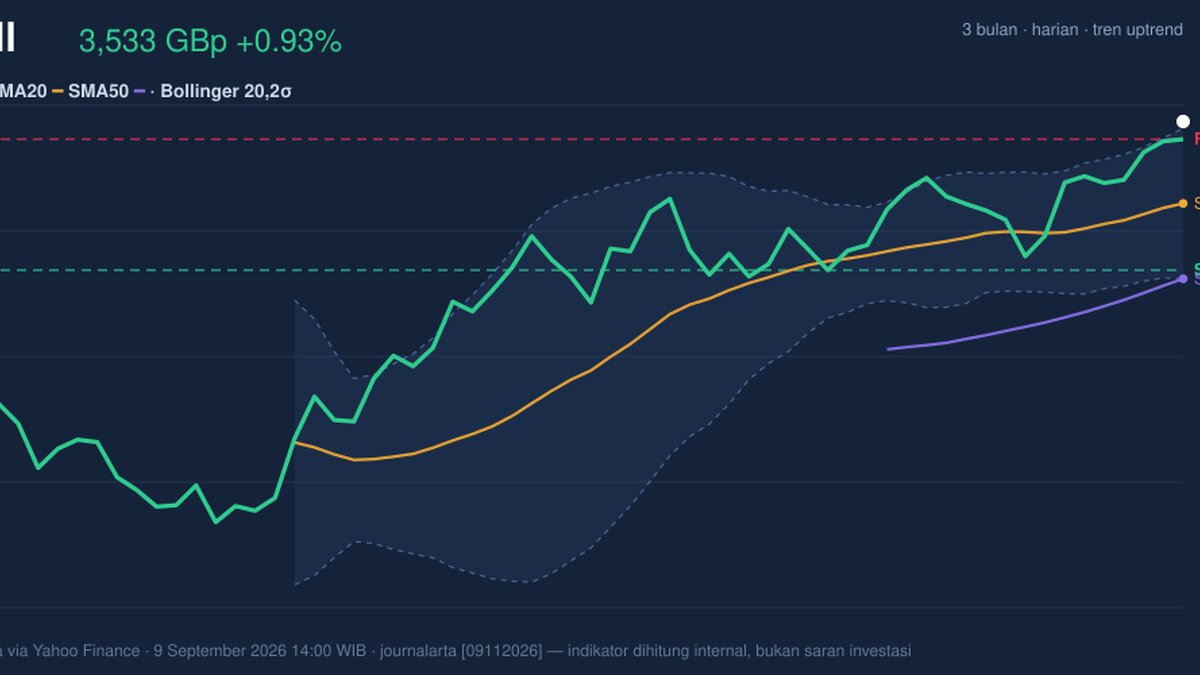
Shell plc edged higher on the LSE in London on Tuesday, with the shares last changing hands at 3,533.00 GBp, up 0.93% on the day and extending a 2.61% five-day rise. The move matters because it puts the stock above a cluster of short- and medium-term trend markers, but it also leaves Shell trading into the upper edge of its recent range, where momentum can look strong right before it starts to need fresh confirmation.
Trend & Price Action
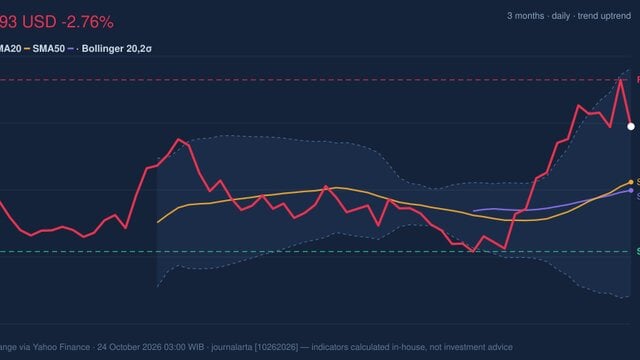
The broader picture remains constructive. Shell is trading above both the SMA20 at 3,397.95 and the SMA50 at 3,273.86, which tells the market the current price is not just bouncing, but sitting above the average levels traders have been willing to pay over roughly the last month and quarter. The uptrend is still intact, and the SMA20 slope of 1.23% over five days shows the short-term trend is still rising rather than flattening out.

The chart also shows why this is a more delicate moment than the headline gain alone suggests. Shell is already above the 20-day upper Bollinger band at 3,522.14, with %B at 104%, which means the price is trading just beyond the band rather than comfortably inside it. That is often read as strength, but it can also signal that the move is extended and may need either a pause or a fresh burst of buying to keep going. The 3,545.50 three-month high is now the nearest reference point for whether this push can turn into a clean breakout or simply stall near resistance.
Oscillators & Momentum
The momentum picture is supportive, but not unambiguously fresh. The RSI at 65.6 is still described as neutral in the data, yet it sits close enough to the upper end of the scale to show the stock has already absorbed a meaningful amount of buying pressure. That matters because RSI does not need to be overbought to warn that upside is becoming more crowded; it only needs to stop rising while price keeps stretching upward.

The Stochastic %K at 82.7 and %D at 87.3 are in overbought territory, which is a more immediate caution flag than RSI. In plain English, the stock is closing near the top of its recent trading range, and that often happens late in a short-term advance. At the same time, the MACD at 53.726 remains above the signal line at 47.677, with a 6.049 histogram, which confirms that upward momentum is still active rather than fading outright. The signal mix is therefore mixed-but-positive: price is extended, but the trend engine has not yet rolled over.
Volatility & Volume
Volatility is not especially wild, but it is not sleepy either. The ATR(14) at 53.93 amounts to about 1.5% of the share price, pointing to moderate daily movement. That gives Shell enough room to make a meaningful directional move without needing a major news shock, which is important when a stock is testing nearby highs.
The Bollinger setup adds another layer. The 7.3% band width is described as a squeeze, meaning the range has narrowed and the market is compressing. Squeezes often precede expansion, so the current setup can be read as a coiled spring: the next move may be larger than the recent day-to-day drift. The direction, however, is still unresolved, and the fact that price is already above the upper band means traders are watching to see whether the stock can keep stretching or mean-revert back toward the middle band at 3,397.95.
Volume does not yet provide strong confirmation. Last turnover of 9,196,845 was only 0.9× the 20-day average of 10,610,320, so the latest rise has not been accompanied by clearly above-normal participation. That is important because breakouts usually look healthier when volume expands with price. The one encouraging counterweight is that OBV is rising, which suggests the underlying accumulation trend is still improving even if the latest session was not especially heavy.
Key Levels & Scenarios
The immediate reference points are clean. Resistance at 3,504.00 has already been cleared, so the market is now probing above a level that had capped the stock on the 20-hour view. That makes the old ceiling a possible new floor if the breakout holds. Below that, support at 3,288.00 remains the key line that would tell traders whether this advance is still structurally healthy or merely a short-lived extension.
Because Shell is trading at 113% of the 20-hour range, the stock is sitting near the top of that recent band rather than in the middle of it. That positioning favors continuation if buyers keep stepping in, but it also means there is less room for complacency if momentum slips. A failure to hold above the broken resistance near 3,504.00 would raise the odds of a pullback toward the middle band and then toward support. A successful hold above that zone, by contrast, would keep attention on the 3,545.50 three-month high as the next technical test.
Technical Verdict: HOLD (wait & see)
HOLD (wait & see)
- MACD remains positive and above its signal line, so the trend is still supported.
- Price is above SMA20 and SMA50, confirming the uptrend structure.
- Stochastic is overbought and price is already above the upper Bollinger band, which argues for caution rather than chasing strength.
Verdict invalidated if price breaks below 3,288.00.
- Ideal Entry Range: 3,504.00 to 3,522.14
- Exit Target: 3,545.50
- Stop Loss protection: 3,288.00
In plain English, Shell still looks technically healthy, but the share price is extended enough that the next move needs to prove itself first.
“The stock is strong, but it is now trading where strength has to keep earning its keep.”
Summary Data Shell
| Last price | 3,533.00 GBp |
| Change 1 day / 5 days / 1 month | 0.93% / 2.61% / 5.27% |
| Trend / MA-cross | uptrend / none |
| SMA20 / SMA50 | 3,397.95 / 3,273.86 |
| RSI (14) / Stochastic %K | 65.6 / 82.7 |
| Bollinger %B / ATR | 104% / 53.93 |
| Support / Resistance 20 days | 3,288.00 / 3,504.00 |
| Data as of | 9 September 2026 14:00 WIB |
Track Shell share price daily: live levels, support/resistance and our full Shell analysis history.