KO Stock Analysis: Drops 2.76%, Golden Cross Formed
On October 23, 2026: price 92.71 USD, trend uptrend, RSI 60.0, support 85.65, resistance 95.34. technical analysis of ko stock. KO Stock Analysis — full…
Why KO is in focus today
- One-day move of -2.76%, about 1.5× its average daily range (ATR)
- Fresh golden cross: SMA20 crossed above SMA50
Selected automatically from 30 NYSE (US) stocks by a technical-signal score with daily weighted randomisation — not a recommendation.
Trend & Price Action
KO remains above its SMA20 of $89.57 and SMA50 of $89.10. A simple moving average tracks the average closing price over a set period; the recent “golden cross” means the shorter average has moved above the longer one, a signal that near-term momentum has improved relative to the preceding trend. The SMA20’s 1.58% rise over five days supports that reading. The price is about 73% of the way through its 20-day range, between support at $85.65 and resistance at $95.34. It is also near the three-month high of $95.37, so the resistance area matters: a sustained move above it would show the latest decline had not derailed the advance, while repeated failure there would leave the stock vulnerable to a deeper retracement. The trend is rising, but the latest session put resistance back in focus.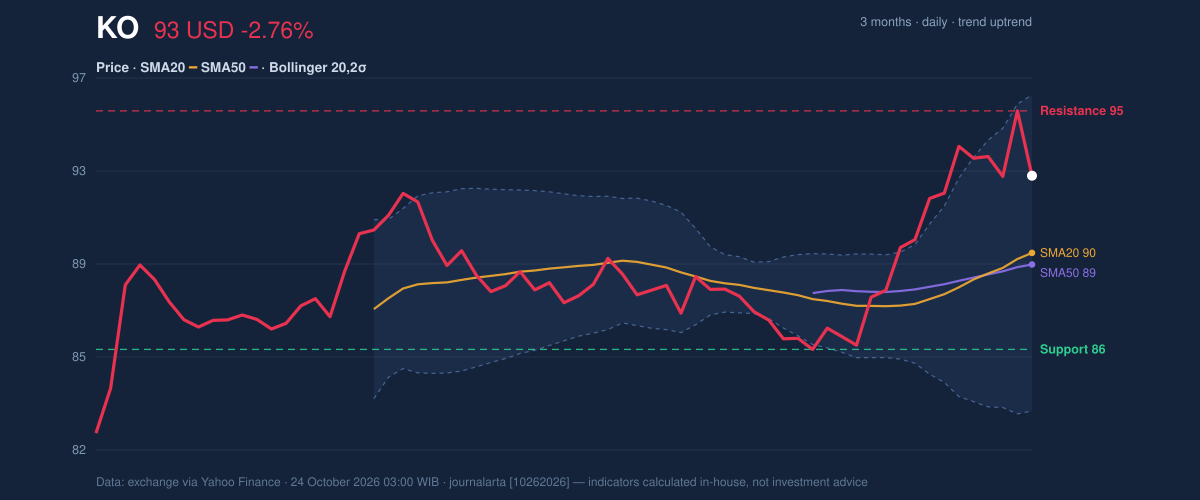
Oscillators & Momentum
The momentum indicators lean positive, though they do not all point with equal strength. The RSI is 60.0, in neutral territory; the Relative Strength Index gauges the pace of recent gains and losses, and this reading suggests room on either side rather than an extreme condition. The Stochastic is also classified as neutral, with %K at 72.6 and %D at 85.5. Its faster line sits below the slower one, a sign that short-term momentum may be cooling even though the reading is not categorized as overbought or oversold. The MACD remains positive: its value of 1.639 is above the 1.124 signal line, and the 0.515 histogram shows the gap is still positive. MACD compares short- and longer-term price momentum. Together, these readings suggest the pullback has not yet overturned the positive momentum picture, but the Stochastic gap argues against treating the advance as uninterrupted.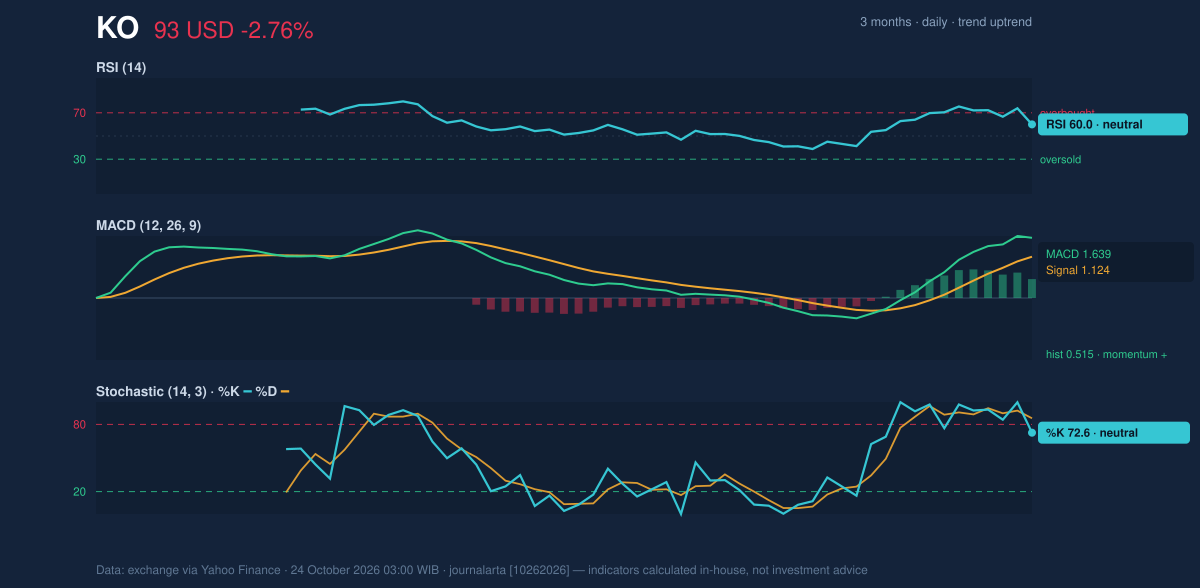
Volatility, Volume & Key Levels
KO’s Bollinger Bands have a middle line at $89.57, an upper band at $95.99 and a lower band at $83.15. The stock’s %B reading of 74% places it in the upper portion of that band range, but not at its ceiling. The 14.3% band width is described as normal, so the data do not indicate an unusually compressed setup or an exceptional volatility expansion. ATR, a measure of typical daily price movement, is $1.68, or 1.8% of the share price: moderate volatility that makes the latest outsized decline worth watching without making it a trend reversal on its own. Volume was 18,890,100 shares, around 1.1 times the 20-day average, while OBV was rising. OBV adds volume on rising sessions and subtracts it on falling ones, so its upward direction suggests participation has generally supported the advance. Still, the latest higher-than-normal volume accompanied a decline, a reason to watch whether support holds rather than dismiss the session as noise. Resistance stands at $95.34, close to the three-month high and below the upper Bollinger Band. Support is $85.65; below that, the lower band at $83.15 is another technical reference. A hold above the rising moving averages would preserve the near-term structure. A break below $85.65 would weaken it and raise the importance of the lower band.Technical Verdict: HOLD (wait & see)
HOLD (wait & see) best fits the mixed evidence. The golden cross and rising SMA20 support the trend; positive MACD and rising OBV offer momentum and volume confirmation. Against that, the stock has pulled back sharply from resistance, and Stochastic %K is below %D, indicating some loss of short-term pace. This verdict is invalidated if KO falls below $85.65, the 20-day support level. - Ideal Entry Range: $89.57–$85.65, using the SMA20 and 20-day support as reference levels. - Exit Target (Target Price): $95.34–$95.99, based on 20-day resistance and the upper Bollinger Band. - Stop Loss: Below $83.15, the lower Bollinger Band; a move there would signal a deeper break in the current structure. For non-traders, the indicators show an improving longer short-term trend but a pullback that has not yet proved its support. Data table (exchange data via Yahoo Finance, October 24, 2026, 03:00 WIB): last price $92.71; daily change -2.76%; five-day change -1.27%; one-month change +5.58%; SMA20 $89.57; SMA50 $89.10; RSI 60.0; Stochastic %K 72.6 / %D 85.5; MACD 1.639 / signal 1.124 / histogram 0.515; ATR $1.68; support $85.65; resistance $95.34; three-month high/low $95.37 / $80.90.Summary Data KO
| Last price | 92.71 USD |
| Change 1 day / 5 days / 1 month | -2.76% / -1.27% / 5.58% |
| Trend / MA-cross | uptrend / golden |
| SMA20 / SMA50 | 89.57 / 89.10 |
| RSI (14) / Stochastic %K | 60.0 / 72.6 |
| Bollinger %B / ATR | 74% / 1.68 |
| Support / Resistance 20 days | 85.65 / 95.34 |
| Data as of | 24 October 2026 03:00 WIB |
Disclaimer: This technical analysis is generated automatically from exchange data (via Yahoo Finance) and indicators calculated by JournalArta, for information and education only. The verdict and the entry, target and stop-loss levels are not investment advice or a solicitation to buy or sell any security. Investment decisions and their risks rest solely with the reader.
Track KO stock price daily: live levels, support/resistance and our full KO analysis history.