UBER Stock Analysis: Drops 3.43%, Testing Support Level
On October 23, 2026: price 66.70 USD, trend downtrend, RSI 39.1, support 66.70, resistance 71.51. technical analysis of uber stock. UBER Stock Analysis — full…
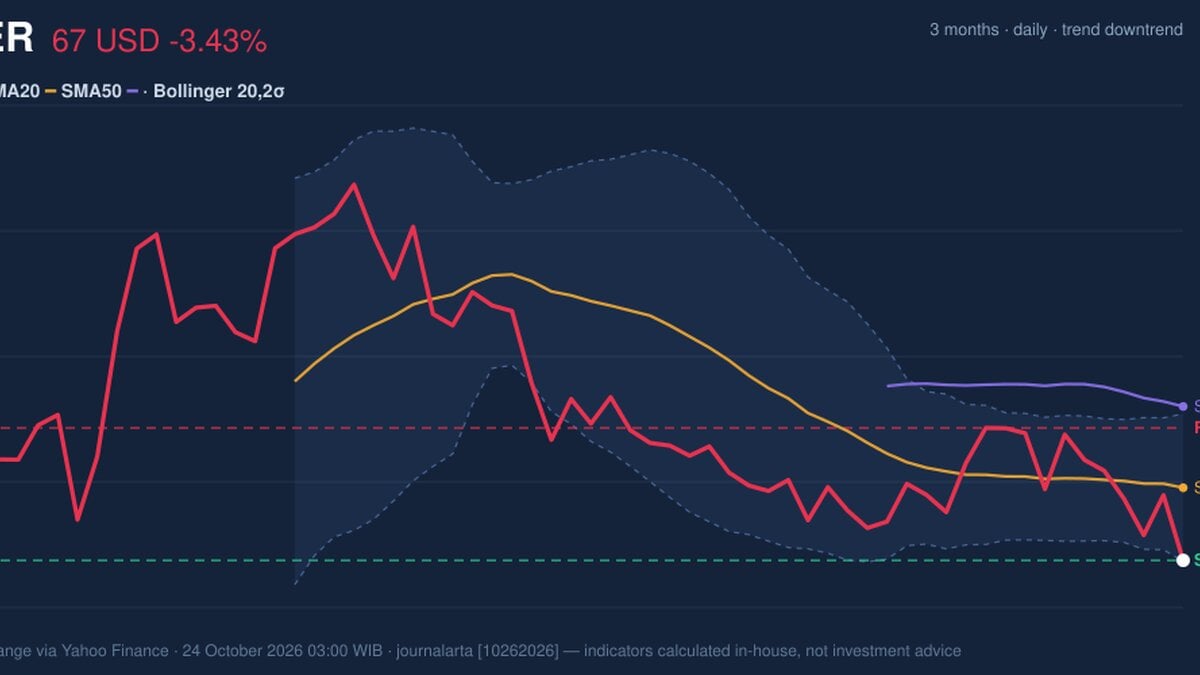
Why UBER is in focus today
- One-day move of -3.43%, about 1.3× its average daily range (ATR)
- Trading near its 3-month low (65.41)
- Downtrend extending (5-day change -5.19%)
Selected automatically from 30 NYSE (US) stocks by a technical-signal score with daily weighted randomisation — not a recommendation.
Trend & Price Action
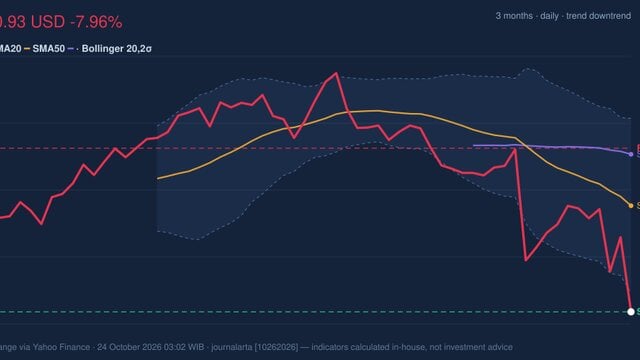
Uber is in a downtrend. Its last price sits below the 20-day moving average, or SMA20, at $69.34, and below the 50-day average at $72.29. The SMA20 is also falling, down 0.48% over five trading days. There has been no recent moving-average crossover, so the chart offers no fresh signal that the broader direction has changed. The stock is at the bottom of its recent trading range: its 20-day support is $66.70, while resistance is $71.51. That placement matters because a support level is an area where buyers have previously stepped in, not a guarantee of a floor. The three-month range, from $65.41 to $82.36, puts the current price close to its low. As shown in the chart, price is pressing the lower Bollinger Band, while both moving averages remain overhead.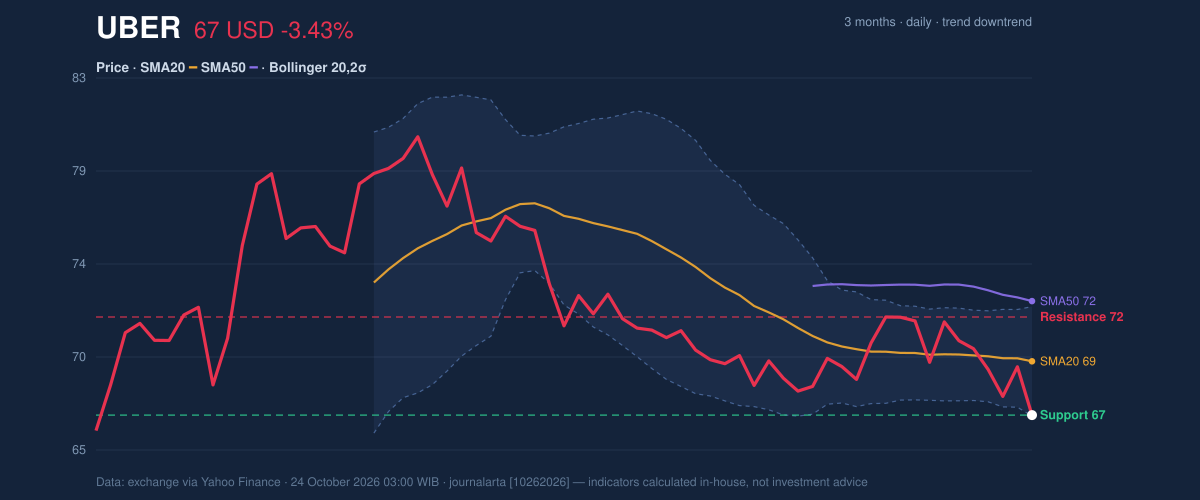
Oscillators & Momentum
The momentum indicators are mixed, but the balance still leans weak. The 14-day RSI is 39.1, a neutral reading that is below the midpoint but not in the conventional oversold zone. By contrast, the Stochastic oscillator is oversold, with %K at 4.8 and %D at 16.5. That can mean selling has been intense, though an oversold reading alone does not establish a reversal. MACD reinforces the caution: its reading is -0.794 against a signal line of -0.645, leaving a negative histogram of -0.149. In plain terms, downward momentum remains in place. The contrast between an oversold Stochastic and negative MACD suggests potential for a pause or rebound, but not confirmation that the trend has turned. The chart below pairs those oscillators so readers can see whether a momentum change develops alongside the price action.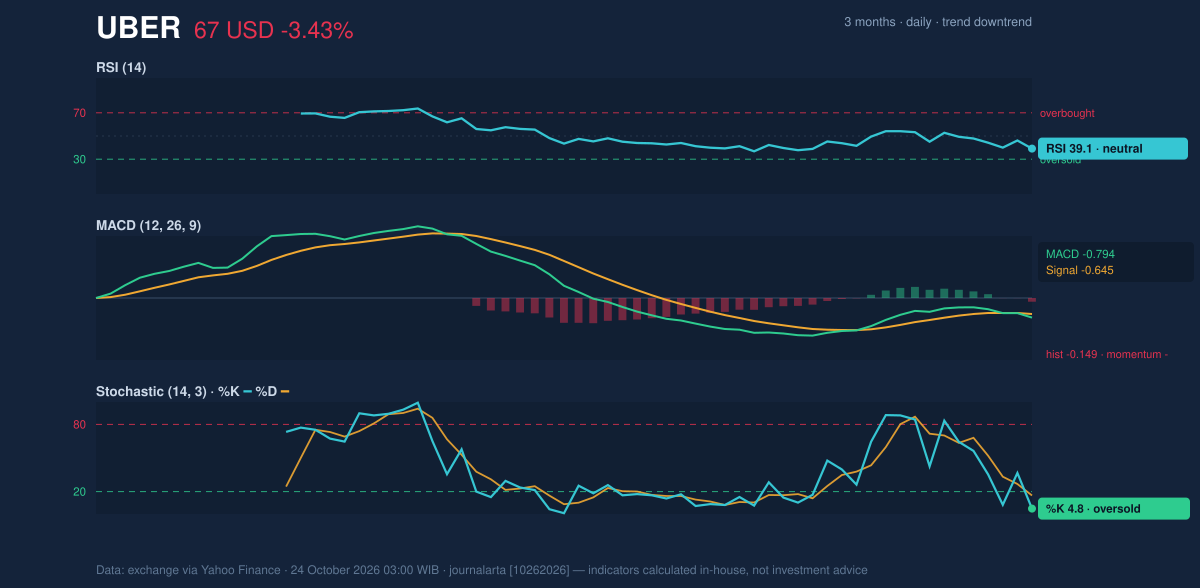
Volatility & Volume
Uber’s Bollinger Band %B is 1%, placing the price close to the lower band at $66.66. The bands are 7.7% wide and narrowing, a squeeze that signals subdued recent range expansion and the possibility of a sharper move when volatility picks up. It does not identify which direction that move will take. With the price already near the band’s lower edge, a break beneath it would add pressure; a sustained move back toward the middle band at $69.34 would be a more constructive sign. Average True Range, a measure of typical price movement, is $1.82, or 2.7% of the share price—moderate volatility. Trading volume reached 18,739,100 shares, about 1.2 times the 20-day average of 15,481,900. Higher-than-normal activity gives the decline more weight, while falling On-Balance Volume (OBV), which tracks whether volume is accumulating on rising or falling sessions, points to weaker buying participation.Key Levels & Scenarios
The immediate test is whether Uber can hold $66.70, the stated 20-day support, and the nearby lower Bollinger Band at $66.66. A break below those levels would expose the three-month low at $65.41. If support holds, a recovery would first need to regain the SMA20 at $69.34; resistance at $71.51 remains the next stated barrier. A move above that level would still face the SMA50 at $72.29.Technical Verdict: HOLD (wait & see)
The technical picture supports a wait-and-see stance rather than a directional call. The falling SMA20 and price below both moving averages show a continuing downtrend; negative MACD and falling OBV do not yet confirm a reversal. The oversold Stochastic and price near the three-month low leave room for a bounce, but are not sufficient confirmation on their own. This verdict is invalidated if price falls below $65.41.- Ideal entry range: $66.66–$69.34, bounded by the lower Bollinger Band and SMA20.
- Exit target: $71.51, the stated resistance level.
- Stop-loss protection: Below $65.41, the three-month low.
| Indicator | Reading |
|---|---|
| Last price | $66.70 |
| Daily change | -3.43% |
| SMA20 / SMA50 | $69.34 / $72.29 |
| RSI / Stochastic | 39.1 / oversold |
| MACD histogram | -0.149 |
| 20-day support / resistance | $66.70 / $71.51 |
| Three-month high / low | $82.36 / $65.41 |
Summary Data UBER
| Last price | 66.70 USD |
| Change 1 day / 5 days / 1 month | -3.43% / -5.19% / -4.19% |
| Trend / MA-cross | downtrend / none |
| SMA20 / SMA50 | 69.34 / 72.29 |
| RSI (14) / Stochastic %K | 39.1 / 4.8 |
| Bollinger %B / ATR | 1% / 1.82 |
| Support / Resistance 20 days | 66.70 / 71.51 |
| Data as of | 24 October 2026 03:00 WIB |
Disclaimer: This technical analysis is generated automatically from exchange data (via Yahoo Finance) and indicators calculated by JournalArta, for information and education only. The verdict and the entry, target and stop-loss levels are not investment advice or a solicitation to buy or sell any security. Investment decisions and their risks rest solely with the reader.
Track UBER stock price daily: live levels, support/resistance and our full UBER analysis history.