Golden Cross Formed, UNH Stock Drops 1.62% on Friday
On October 23, 2026: price 418.09 USD, trend uptrend, RSI 65.9, support 365.20, resistance 424.98. technical analysis of unh stock. Golden Cross Formed — full…
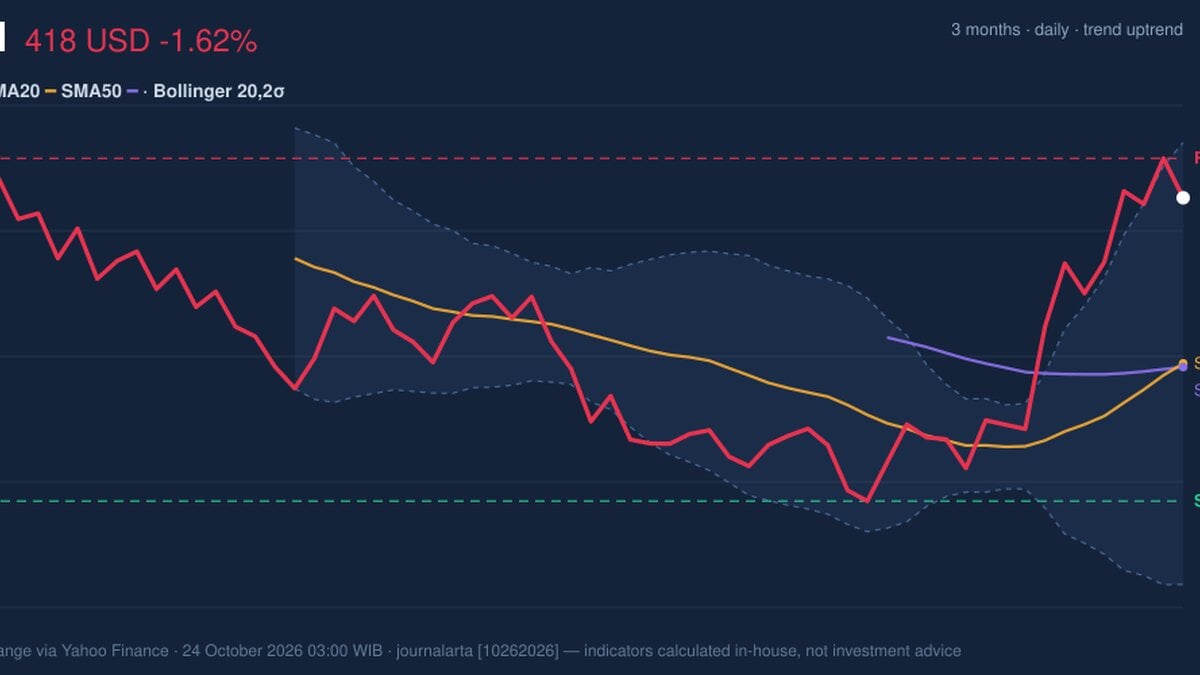
Trend & Price Action
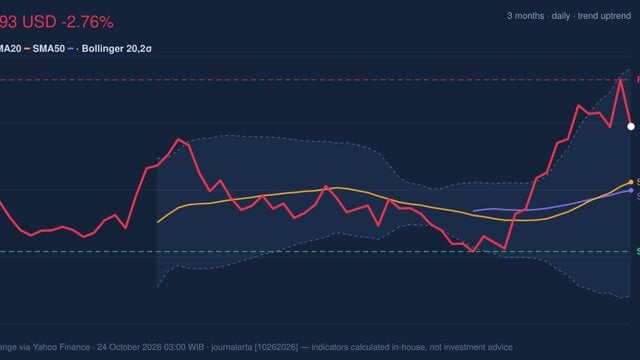
UnitedHealth’s shares are up 4.15% over five days and 11.02% over one month. The stock trades above its 20-day simple moving average (SMA), at $389.21, and its 50-day SMA, at $388.57. The 20-day average has crossed above the 50-day average—a golden cross—while the shorter average has risen 2.81% over five days. Together, those measures point to improving trend strength rather than a one-day bounce. But price has advanced toward a meaningful test. At $418.09, UNH is at 88% of its 20-trading-day range, with resistance at $424.98; its three-month high is $431.68. That proximity makes the latest decline important: it may reflect routine profit-taking, but a sustained move above resistance would provide stronger evidence that buyers can extend the advance. The chart shows the share price above both moving averages and approaching the upper Bollinger band, a statistical measure of how far price has moved from its recent average.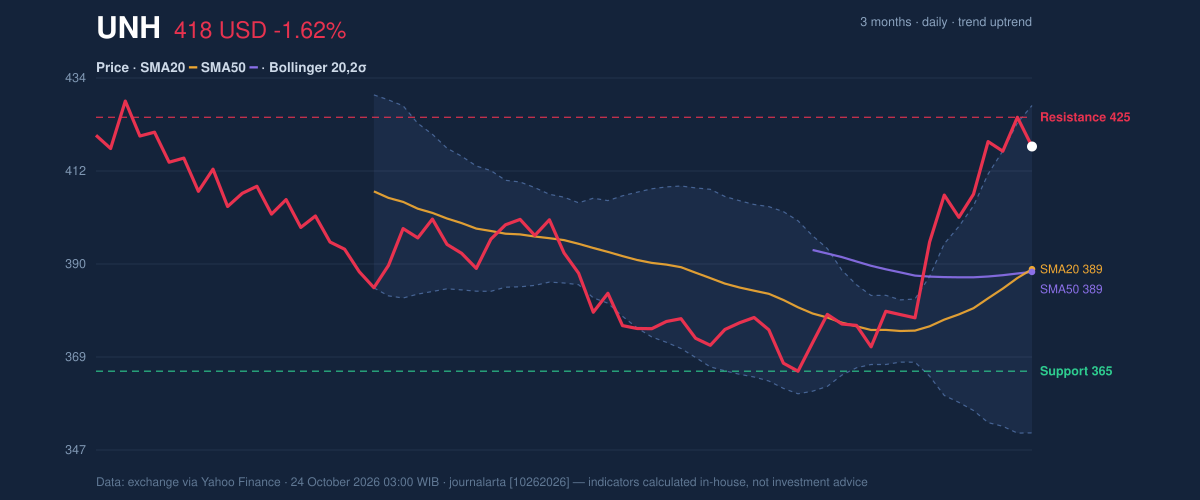
Oscillators & Momentum
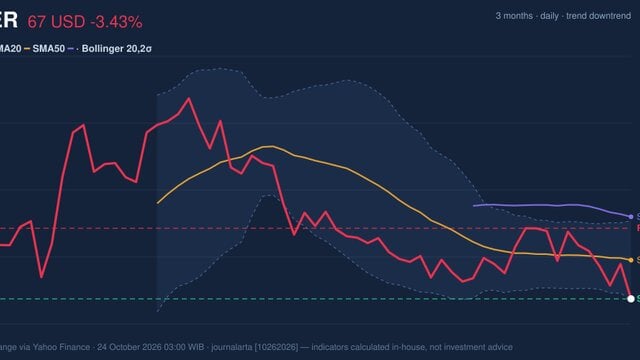
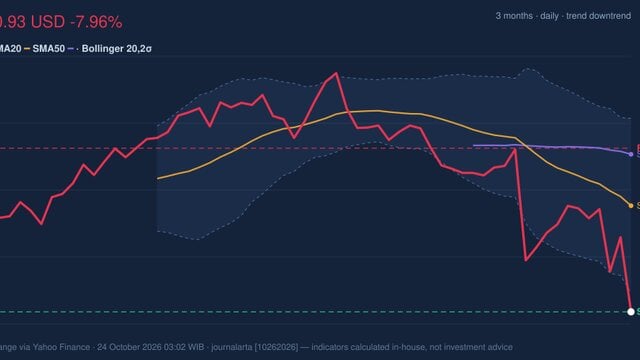
Momentum indicators are positive but not uniformly comfortable. The relative strength index (RSI), which gauges the pace of recent gains and losses, is 65.9 and classified as neutral in the supplied data. That is consistent with firm momentum without, by itself, signaling an extreme reading. The stochastic oscillator is more cautionary: %K is 85.4 and %D is 91.1, both reflecting an overbought condition. Overbought does not mean a decline must follow; it means the price has risen quickly enough that the rally may be vulnerable to a pause or a sharper pullback if new buyers do not arrive. The MACD, a trend-following momentum measure, remains positive: its reading of 9.529 is above the 4.454 signal line, leaving a positive histogram of 5.074. That supports the upward trend, even as the stochastic reading suggests near-term exuberance. The momentum chart puts those signals side by side: positive MACD, neutral RSI and elevated stochastic readings.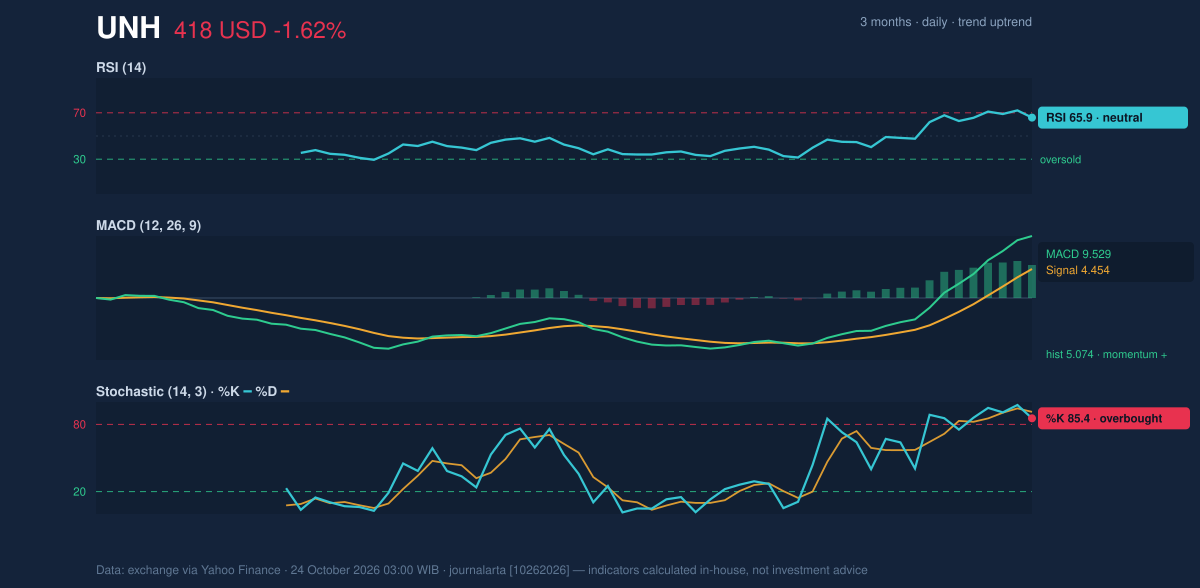
Volatility, Volume & Key Levels
UNH’s price stands at 87% of the range between the 20-day Bollinger bands, whose upper and lower boundaries are $427.75 and $350.67. The band width is 19.8%, described as normal rather than unusually narrow or expanded. The stock is therefore nearing the upper band, but the data do not point to a volatility squeeze that would imply an imminent breakout. Average true range, a measure of typical price movement, is $13.08, or 3.1% of the share price—moderate volatility. Trading volume was 3.888 million shares, about 0.6 times the 20-day average of 6.047 million. That makes the latest drop less conclusive as evidence of broad selling pressure. On-balance volume, which tracks whether volume accompanies rising or falling prices, is rising, offering a counterpoint that participation has generally supported the advance. The nearest test is $424.98 resistance. A sustained break above it would put the three-month high of $431.68 in focus. If the stock fails to hold its ground, the closely grouped averages around $389 offer an intermediate reference, while $365.20 support marks the lower boundary of the stated 20-day support range. A drop below that support would weaken the bullish technical case.Technical Verdict: HOLD (wait & see)
The indicators show a rising trend, but the stock is close to resistance and short-term stochastic momentum is overbought. The lighter volume on the latest decline and rising OBV temper, rather than remove, that caution.- Ideal Entry Range: $389.21–$424.98, framed by the 20-day SMA and the stated resistance; the wide range reflects the unresolved test near resistance.
- Exit Target (Target Price): $431.68, the three-month high and the next cited price reference above resistance.
- Stop Loss protection: $365.20, the 20-trading-day support level.
Technical analysis is not an investment recommendation.
Why UNH is in focus today
- Fresh golden cross: SMA20 crossed above SMA50
- Uptrend confirmed (5-day change 4.15%)
Selected automatically from 30 NYSE (US) stocks by a technical-signal score with daily weighted randomisation — not a recommendation.
Summary Data UNH
| Last price | 418.09 USD |
| Change 1 day / 5 days / 1 month | -1.62% / 4.15% / 11.02% |
| Trend / MA-cross | uptrend / golden |
| SMA20 / SMA50 | 389.21 / 388.57 |
| RSI (14) / Stochastic %K | 65.9 / 85.4 |
| Bollinger %B / ATR | 87% / 13.08 |
| Support / Resistance 20 days | 365.20 / 424.98 |
| Data as of | 24 October 2026 03:00 WIB |
Disclaimer: This technical analysis is generated automatically from exchange data (via Yahoo Finance) and indicators calculated by JournalArta, for information and education only. The verdict and the entry, target and stop-loss levels are not investment advice or a solicitation to buy or sell any security. Investment decisions and their risks rest solely with the reader.
Track UNH stock price daily: live levels, support/resistance and our full UNH analysis history.