AstraZeneca Stock Gains 1.58% Today, Momentum Weakens
On Juli 28, 2026: price 12,888.00 GBp, trend downtrend, RSI 40.3, support 12,364.00, resistance 14,538.00. technical analysis of astrazeneca stock.

According to data from the LSE via Yahoo Finance, AstraZeneca (AZN.L) last traded at 12,888.00 GBp, up 1.58% on the day, but still sitting beneath both its short- and medium-term moving averages. That matters because the share price is not being led by trend strength; it is trying to stabilise inside a broader downtrend, with the SMA20 at 13,291.60 and the SMA50 at 13,503.24 both overhead. The stock has also fallen 9.99% over one month, a reminder that the latest bounce is happening after a weak stretch rather than in the middle of a strong advance.
Trend & Price Action
The chart shows a share price that is still trading below the SMA20, while the SMA20 itself is pointing lower, with a -2.29% slope over five days. That combination usually signals that recent buying has not yet been strong enough to reverse the prevailing trend. In plain terms, sellers still control the tape, even if they are no longer dominating every session.
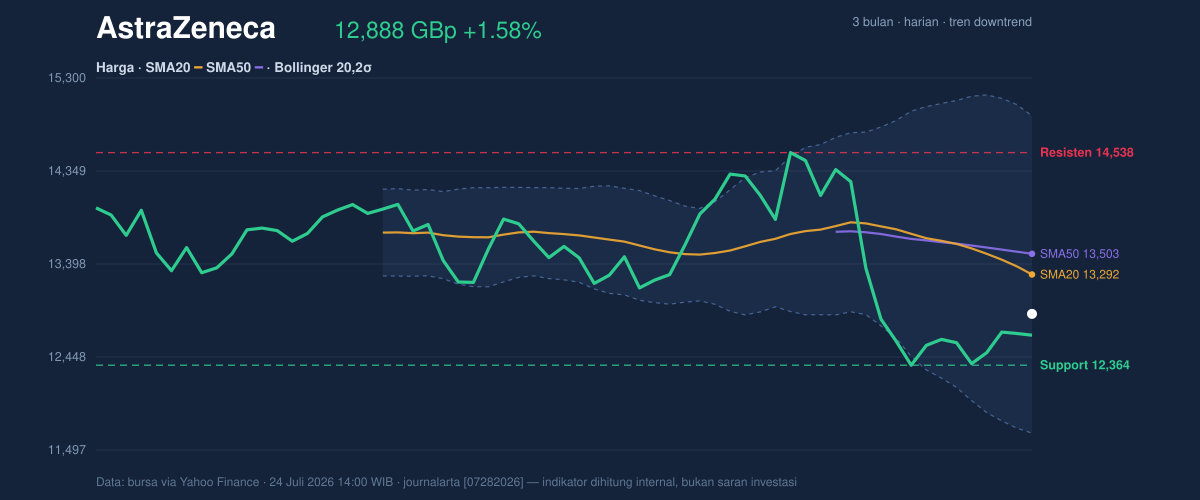
Price is currently positioned at roughly 24% of the 20-hour range, which places it in the lower part of the recent trading band rather than near breakout territory. The nearest support is 12,364.00, while resistance stands at 14,538.00. That gap is wide enough to matter: the stock has room to move either way, but it first needs to prove it can reclaim the middle of the range before any case for trend repair becomes more credible.
The Bollinger Bands reinforce that message. The middle band sits at 13,291.60, matching the SMA20, which means the market is using that level as its pivot. With the upper band at 14,913.67 and the lower band at 11,669.53, the share price is currently below the midline but not yet pressed against the lower band. That usually suggests a market that is weak, but not yet in panic. The %B of 38% shows price is below the centre of the band structure, while the 24.4% band width says volatility has expanded, so moves can travel faster once direction is chosen.
Oscillators & Momentum
The momentum picture is mixed on the surface and negative underneath. RSI at 40.3 is technically neutral, which means the stock is not oversold enough to imply an automatic rebound, nor overbought enough to suggest exhaustion. That matters because neutral RSI in a downtrend often means the market is pausing, not reversing.
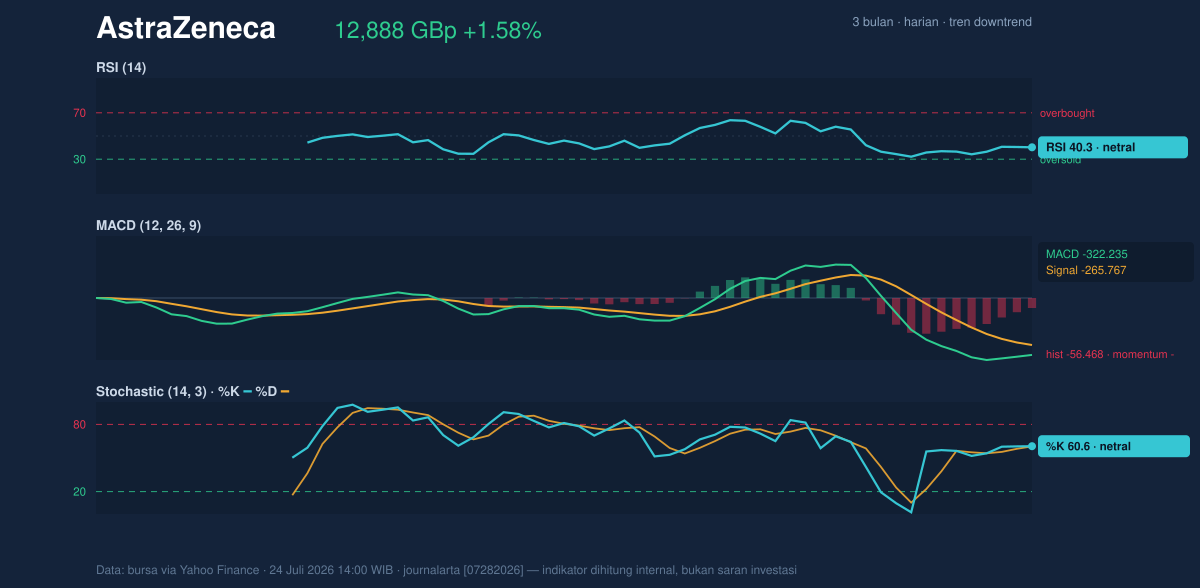
Stochastic %K at 60.6 and %D at 60.3 are also neutral, with no obvious oversold signal to support an aggressive turn higher. The more important read is from MACD: MACD at -322.235, below its signal line at -265.767, with a histogram of -56.468. That configuration means downside momentum still exceeds upside momentum. In other words, the share price may have bounced, but the trend engine has not yet flipped.
The absence of a fresh moving-average cross is another quiet warning. A new bullish cross would normally suggest that short-term momentum is overtaking longer-term weakness. Here, that signal has not appeared, so the chart remains in a waiting pattern rather than a confirmed reversal.
Volatility & Volume
Volatility is elevated. ATR(14) at 748.08, equal to 5.8% of the share price, means the stock can move a meaningful distance in a single session without that necessarily changing the broader trend. That is useful context for interpreting the recent rise: a one-day gain can look impressive, but in a high-ATR environment it may still be only a routine swing.
Volume does not yet confirm the move. The latest reading of 1,845,837 compares with a 20-hour average of 2,528,181, or about 0.7x normal. Lower turnover on a rebound often suggests caution rather than conviction. The OBV is falling, which is more important than the day’s volume alone because it indicates that, over time, more volume has been associated with down days than up days. That is a classic sign that institutional participation has not yet turned supportive.
Put together, the message is straightforward: the stock is bouncing, but the bounce is not yet being validated by participation. As shown in the chart, price is still trying to recover lost ground while momentum remains negative and volume remains light.
Key Levels & Scenarios
12,364.00 is the first level that matters on the downside. If that support gives way, the market would be moving deeper into the lower half of the recent range, and the next test would likely come against the broader band structure rather than against a clean trend floor. On the upside, 13,291.60 is the first reclaim level because it aligns with both the SMA20 and the Bollinger midline. A move through that area would be more meaningful than a simple intraday pop, because it would show price can get back above the market’s short-term reference point.
The stronger barrier is 14,538.00 resistance. If the stock can clear that area, it would be moving back toward the upper Bollinger band at 14,913.67, which is where the chart would start to look less defensive. Until then, the price action still sits below the key averages, and the burden of proof remains on the bulls.
Technical Verdict: HOLD (wait & see)
HOLD (wait & see) because the chart is not weak enough to justify panic, but it is also not strong enough to confirm a trend reversal.
- MACD remains negative, with the line below signal and a bearish histogram, so momentum still points down.
- Price is below the SMA20 and SMA50, and the SMA20 is sloping lower, which keeps the trend classification bearish.
- Volume is only 0.7x normal and OBV is falling, so the latest bounce lacks participation.
- Verdict invalidated if price breaks above 14,538.00 with follow-through, because that would challenge the current resistance structure.
- Ideal Entry Range: 12,364.00 to 13,291.60
- Exit Target: 14,538.00 to 14,913.67
- Stop Loss protection: below 11,669.53
For non-traders, this means AstraZeneca is bouncing, but the chart still needs proof before the move can be treated as more than a recovery attempt.
The latest 3-month high is 15,126.00 and the 3-month low is 9,892.00.
Summary Data AstraZeneca
| Last price | 12,888.00 GBp |
| Change 1 day / 5 days / 1 month | 1.58% / 2.33% / -9.99% |
| Trend / MA-cross | downtrend / none |
| SMA20 / SMA50 | 13,291.60 / 13,503.24 |
| RSI (14) / Stochastic %K | 40.3 / 60.6 |
| Bollinger %B / ATR | 38% / 748.08 |
| Support / Resistance 20 days | 12,364.00 / 14,538.00 |
| Data as of | 24 Juli 2026 14:00 WIB |

