HSBC Stock Gains 1.58% Today, RSI Overbought
On Juli 28, 2026: price 1,551.20 GBp, trend uptrend, RSI 70.5, support 1,423.80, resistance 1,552.80. technical analysis of hsbc stock.

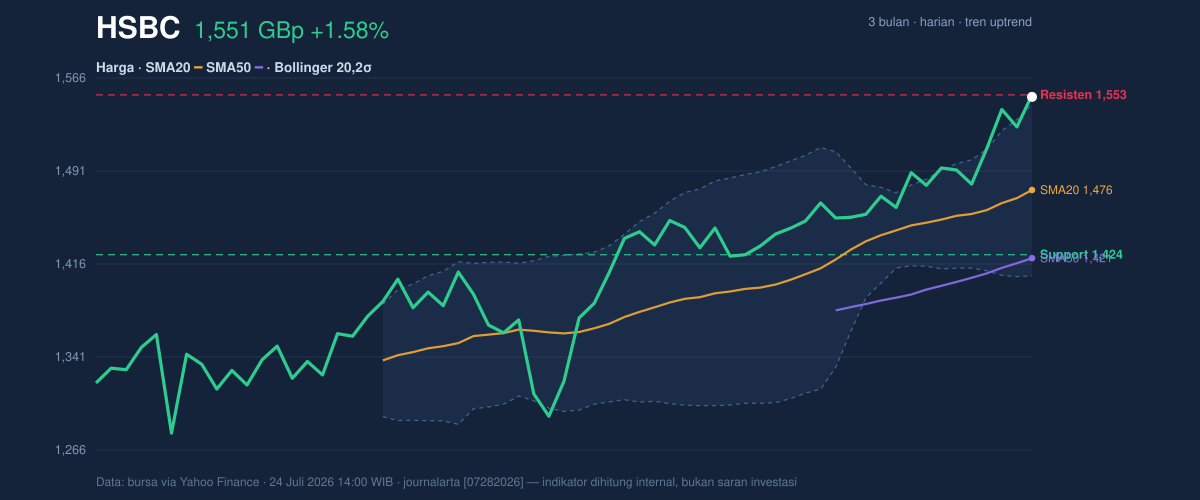
HSBC Holdings’ shares on the LSE were trading at 1,551.20 GBp on 24 July 2026 at 14:00 WIB, up 1.58% on the day and pressing to within a whisker of the session’s 1,552.80 resistance, according to exchange data via Yahoo Finance. That matters because the stock is not just rising — it is rising from strength: it sits above both its SMA20 at 1,476.02 and SMA50 at 1,420.96, with the shorter average still climbing. In plain terms, buyers have been in control for long enough that the trend is now feeding on itself, but the chart also shows the move is getting stretched.
Trend & Price Action
HSBC’s structure is firmly bullish. The price is above the SMA20 and SMA50, and the SMA20 slope is up 1.43% over 5 days, which signals that recent gains are not a one-day spike but part of a broader advance. There is no fresh MA-cross — no new crossover between the moving averages — which means the trend is not being confirmed by a brand-new technical trigger, but rather continues to extend from an already established position. As shown in the chart, the stock is also trading near the top of its 3-month range, with the latest price sitting just below the 1,590.00 high and well above the 1,256.20 low.
This is the kind of setup that often attracts momentum-following flows, because a stock near the upper end of its range tells the market that sellers have not yet forced a meaningful retracement. But proximity to resistance also means the next move matters more than the last one.
The immediate message from price action is simple: HSBC is testing whether strength can become a breakout, or whether the rally is merely pausing under overhead supply.
Oscillators & Momentum
Momentum is positive, but it is also hot. The RSI(14) at 70.5 is in overbought territory, and the Stochastic %K at 100.0 versus %D at 84.4 is also overbought. For non-traders, that does not mean the stock must fall; it means recent gains have been fast enough that the market may be vulnerable to a pause, even while the trend remains intact. In other words, the oscillator signals are not bearish by themselves — they are warning that the pace of the advance has become extended.
That warning is partly offset by the MACD at 32.172, which remains above its signal line at 26.967, with a histogram of 5.205. MACD is a trend-following momentum measure, so when it stays above the signal line and the histogram is positive, it usually means upward momentum is still dominating. The chart therefore shows a split message: trend strength is alive, but the shorter-term oscillators are flashing fatigue.
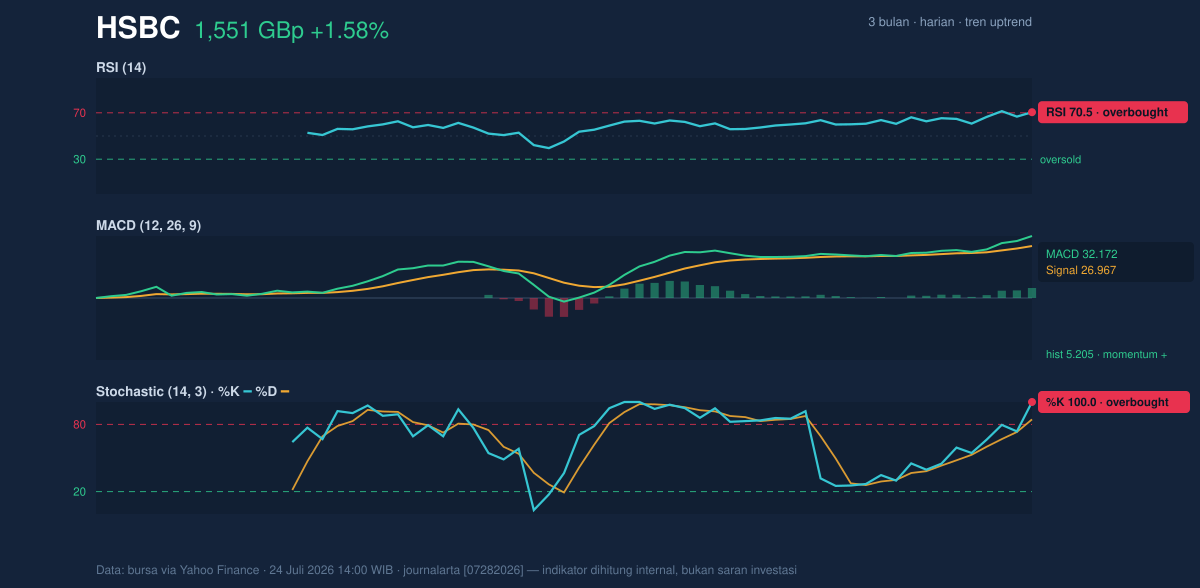
This combination often appears near short-term inflection points: strong trend, crowded momentum, and a market that needs either fresh buying or a brief reset.
Volatility & Volume
The volatility backdrop is not extreme. ATR(14) at 35.63, equal to 2.3% of price, points to moderate volatility, meaning daily swings are noticeable but not disorderly. Bollinger Bands add an important nuance. HSBC’s price is above the upper band at 1,545.26, with %B at 104%. That tells readers the stock is trading beyond the normal envelope of its recent 20-day range. This is usually a sign of strong momentum — but also of extension. The 9.4% band width is described as normal, so this is not a volatility squeeze waiting to burst; instead, it is a steady trend that has pushed to the edge of its statistical range.
Volume confirms participation rather than exhaustion. Last volume came in at 20,736,753, compared with an average of 18,704,865, or 1.1× normal. That is not a dramatic surge, but it is enough to show the move is being supported by real trading activity. The OBV is rising, which is important because on-balance volume tracks whether money flow has been accumulating alongside price. Rising OBV alongside rising price usually means the advance has backing, not just headline excitement.
Put together, the tape says the market is still willing to pay up for HSBC — but it is doing so at a level where momentum traders are often most exposed to sharp pauses.
Key Levels & Scenarios
The nearest technical reference points are tightly clustered. The stock is trading just beneath the 1,552.80 resistance, while the 1,545.26 upper Bollinger band now acts as a nearby momentum threshold. On the downside, the most visible support sits at 1,423.80, which also lies close to the lower part of the recent trading structure and above the 1,406.78 Bollinger lower band. Because the price is already near the top of its range, the market is effectively asking whether it can convert resistance into support.
If HSBC clears and holds above 1,552.80, the chart would suggest continuation toward the 1,590.00 3-month high becomes the next technical reference. If it fails to hold the upper edge of the range, a retreat toward the 1,476.02 SMA20 would indicate the rally is cooling rather than breaking. A deeper move through 1,423.80 would be more serious, because it would place price back into the lower half of the recent structure and weaken the case that the uptrend is intact.
Technical Verdict: HOLD (wait & see)
HOLD (wait & see) fits best because the chart is still in an uptrend, MACD is positive, and OBV is rising, but the stock is also overbought on RSI and Stochastic while trading above the upper Bollinger band. That mix usually means strength is real, yet short-term upside may be getting harder to extend without a pause.
- Ideal entry range: around 1,545.26 to 1,476.02, where the upper band and SMA20 may offer a better risk-reward zone.
- Exit target: 1,590.00, the 3-month high and the next visible resistance reference.
- Stop loss protection: below 1,423.80, where the recent support structure would be challenged.
This means HSBC is still technically strong, but the chart is stretched enough that the next move matters more than the last one.
Latest volume: 20,736,753 shares, versus a 18,704,865 average.
Summary Data HSBC
| Last price | 1,551.20 GBp |
| Change 1 day / 5 days / 1 month | 1.58% / 3.95% / 9.04% |
| Trend / MA-cross | uptrend / none |
| SMA20 / SMA50 | 1,476.02 / 1,420.96 |
| RSI (14) / Stochastic %K | 70.5 / 100.0 |
| Bollinger %B / ATR | 104% / 35.63 |
| Support / Resistance 20 days | 1,423.80 / 1,552.80 |
| Data as of | 24 Juli 2026 14:00 WIB |

