Momentum Weakens, HD Stock Gains 2.49% Today
On Juli 29, 2026: price 344.47 USD, trend sideways, RSI 56.2, support 324.71, resistance 357.90. technical analysis of hd stock. Momentum Weakens — full…

Home Depot shares rose to 344.47 on the NYSE, up 2.49% from the previous close of 336.09, as trading pushed the stock back above its short-term average and toward the upper half of its recent range. That move matters because it shows buyers were willing to step in after a weak month: the stock is still down 1.81% over one month, but the latest session suggests the market is testing whether the slide has run its course or whether this is just a rebound inside a broader sideways pattern.
Trend & Price Action
The chart shows Home Depot trading above its SMA20 at 340.65 and well above its SMA50 at 328.89, which usually tells readers the stock has recovered its immediate footing even if the larger trend is not yet firmly directional. The key nuance is that the trend is still labeled sideways, with the SMA20 slope at -0.62% over 5 days. In plain terms, that means the short-term average is still drifting lower even while price is sitting above it — a sign of stabilization, not a confirmed breakout.
The absence of a fresh MA-cross also matters. A moving-average cross is one of the cleaner trend signals: when a shorter average overtakes a longer one, it often marks a shift in momentum. Here, no new cross means the market has not yet delivered that kind of confirmation. Price is improving, but the structure still looks like repair work rather than a decisive trend change.
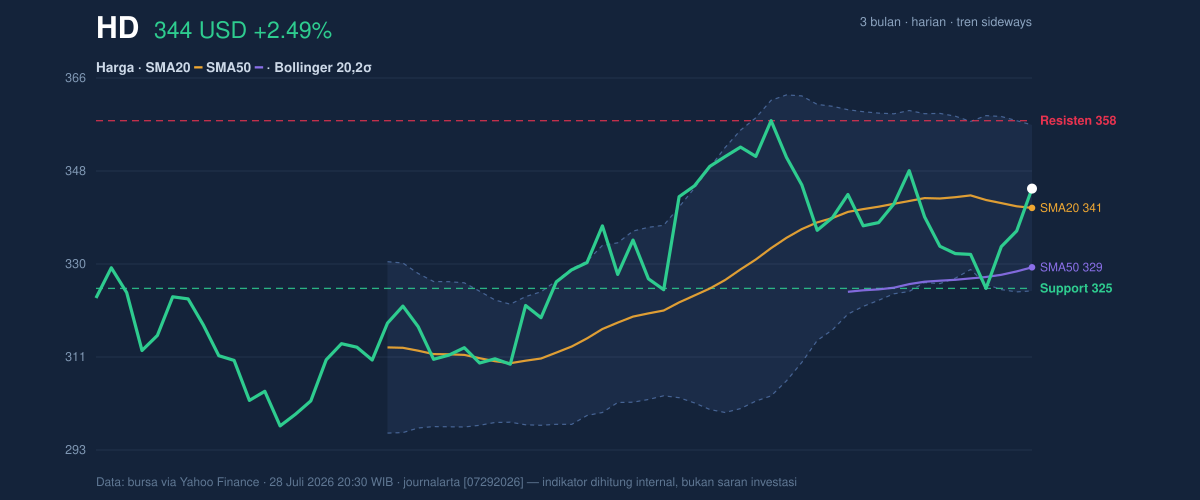
Home Depot is also trading in the 60% area of its 20-day range, with support at 324.71 and resistance at 357.90. That placement says the stock is no longer near the lower boundary, but it has not yet reached the point where sellers have clearly been forced out. The three-month high of 358.85 sits just above that resistance, which makes the upper band important: a move through that zone would place price back near the top of its recent trading envelope.
Short sentence: the stock is recovering, but it is not yet out of the range.
Oscillators & Momentum
The momentum picture is mixed, and the chart makes that tension visible. RSI at 56.2 is neutral, which means the stock is neither stretched to the upside nor washed out to the downside. That is often a healthy reading during a recovery phase, because it leaves room for follow-through without signaling exhaustion.
Still, the Stochastic reading of 69.3 / 47.4 suggests the stock is gaining near-term traction, but not in a fully synchronized way. Stochastic compares where price is now versus its recent range; when the faster line is above the slower line, it usually shows improving short-term momentum. Here, the separation supports the rebound, but the gap is not wide enough to imply a strong breakout already underway.
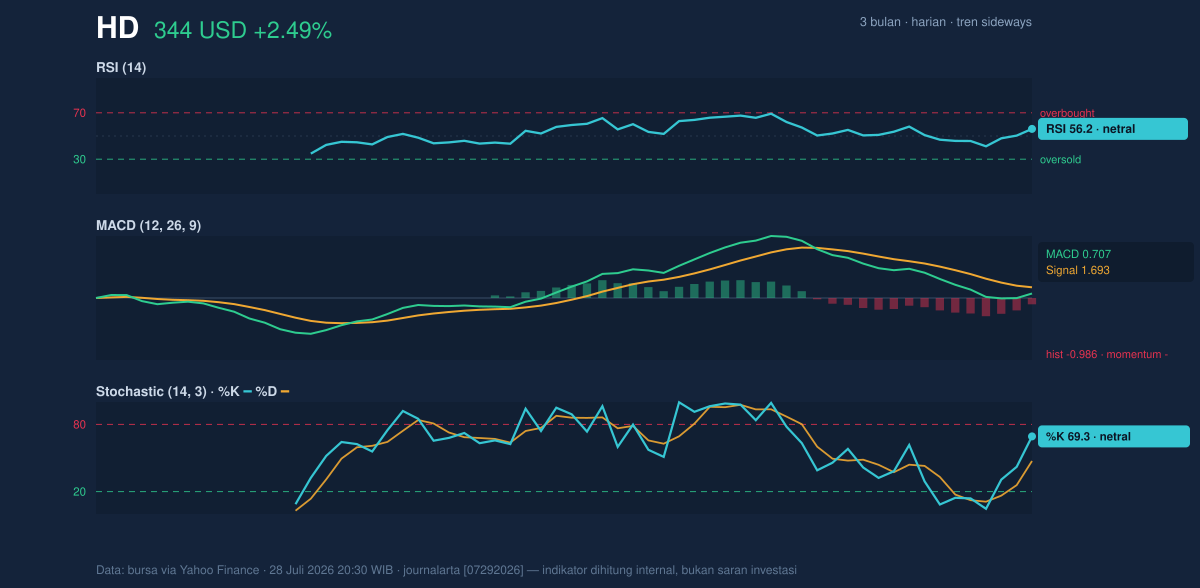
The more cautionary signal comes from MACD. MACD at 0.707 is below its signal line at 1.693, leaving a histogram of -0.986. That negative histogram means the underlying momentum is still lagging even though price has risen. In practical terms, traders are seeing a bounce in price before the trend indicators have fully turned. This is why the stock can look firm on the surface while still lacking strong internal momentum.
Short sentence: price improved faster than momentum did.
Volatility & Volume
Volatility is not elevated enough to suggest panic, but it is active enough to matter. ATR at 8.79, or 2.6% of price, points to moderate volatility. ATR measures the typical daily range, so this reading implies Home Depot can still move meaningfully from one session to the next without being unusually erratic. For readers, that means the recent move has room to extend, but it also has room to reverse if buyers fail to keep control.
The Bollinger Bands reinforce that idea. The stock’s %B at 62% places price above the mid-band at 340.65 but below the upper band at 357.08. The 9.6% band width is described as normal, which indicates the market is not in a squeeze — the kind of compressed setup that often precedes a sharp expansion — nor is it in a volatility spike. In other words, the stock is moving within a routine envelope, not in a dramatic breakout structure.
Volume adds a constructive note. Latest volume of 4,308,000 was about 1.2× the 20-day average of 3,731,710, and OBV is rising. OBV, or on-balance volume, tracks whether trading flow is accumulating or distributing over time. A rising OBV alongside a price rebound suggests the move has participation behind it, which is more credible than a thin rally on weak turnover.
Short sentence: buyers showed up, but not with enough force to erase all doubt.
Key Levels & Scenarios
The nearest technical map is straightforward. Support at 324.71 is the first line that needs to hold if this rebound is to remain intact, while resistance at 357.90 is the next ceiling to watch. The Bollinger upper band at 357.08 sits almost on top of that resistance, which makes the area especially important: if price reaches it, the market will be testing both a statistical boundary and a prior price barrier at the same time.
If Home Depot can push through 357.08-357.90, the chart would begin to resemble a renewed advance rather than a range-bound rebound. If it fails there, the stock is likely still trapped in the broader sideways structure. The three-month high at 358.85 is the next reference above resistance, while the three-month low at 289.10 remains the broader downside anchor.
Technical Verdict: HOLD (wait & see)
HOLD (wait & see)
- Price is above SMA20 and SMA50, which supports the rebound.
- MACD histogram is negative, showing momentum has not fully confirmed the move.
- Volume is 1.2× normal and OBV is rising, so participation is improving, but the trend is still sideways.
Verdict invalidated if price breaks/falls below 324.71.
- Ideal Entry Range: 340.65 to 344.47
- Exit Target: 357.08 to 357.90
- Stop Loss protection: 324.71
In plain English, the stock has repaired some damage, but it still needs momentum to prove the rebound is real.
The next technical test is whether Home Depot can close above the 357.08-357.90 barrier, with the market watching that zone against the backdrop of the next earnings-related company update.
Summary Data HD
| Last price | 344.47 USD |
| Change 1 day / 5 days / 1 month | 2.49% / 3.88% / -1.81% |
| Trend / MA-cross | sideways / none |
| SMA20 / SMA50 | 340.65 / 328.89 |
| RSI (14) / Stochastic %K | 56.2 / 69.3 |
| Bollinger %B / ATR | 62% / 8.79 |
| Support / Resistance 20 days | 324.71 / 357.90 |
| Data as of | 28 Juli 2026 20:30 WIB |
