BLK Stock Drops 2.44% on Friday, Golden Cross Formed
On October 30, 2026: price 1,147.54 USD, trend uptrend, RSI 58.3, support 1,065.35, resistance 1,176.24. technical analysis of blk stock.
By Elena Vance
November 2, 20264 min read
Logo BlackRock — JournalArta illustration
Why BLK is in focus today
Fresh golden cross: SMA20 crossed above SMA50
Uptrend confirmed (5-day change 2.62%)
Not covered by JournalArta in the last 14 days
Selected automatically from 80 NYSE (US) stocks by a technical-signal score with daily weighted randomisation — not a recommendation.
BlackRock closed at $1,147.54 on Friday, October 30, after falling 2.44% in the session, even as its five-day gain reached 2.62%. The pullback puts the asset manager at a useful technical crossroads: a golden cross formed one session earlier, while price remains above its rising 20-day average. That mix makes the stock worth watching, but the latest decline and light trading volume temper the bullish signal.
Trend & Price Action
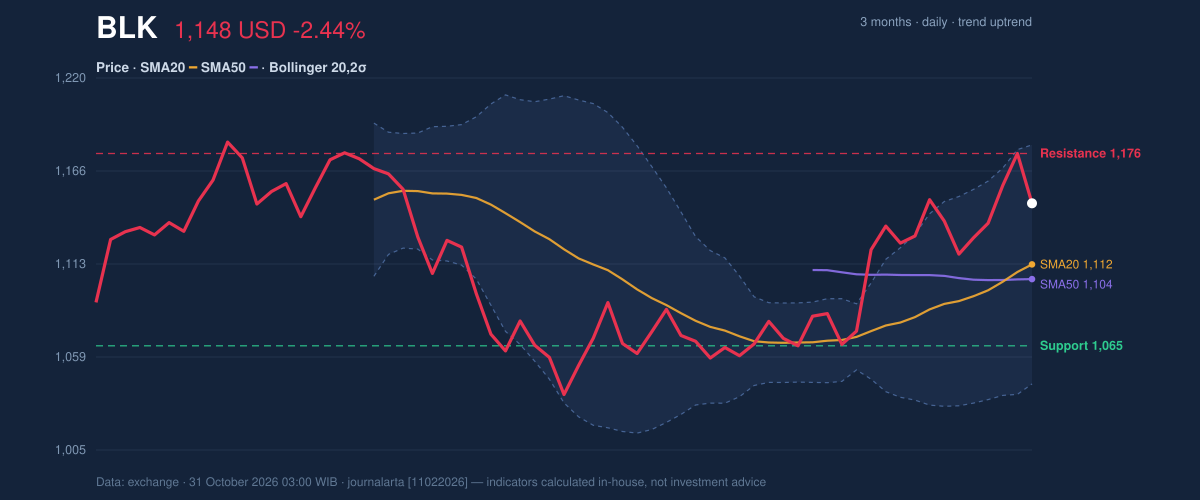
The short-term trend remains upward. BlackRock trades above its 20-day simple moving average, or SMA, at $1,112.30 and its 50-day SMA at $1,103.80. The 20-day average rose 1.94% over five days, and its move above the 50-day average—a pattern known as a golden cross—formed one session before the latest session. The crossover suggests improving short-term momentum, though it is a lagging signal rather than a guarantee of further gains.
The session’s drop follows an 8.30% rise over the past month. At $1,147.54, the stock sits 74% of the way through its 20-day range, between support at $1,065.35 and resistance at $1,176.24. It remains below the three-month high of $1,187.17. The retreat therefore looks like a pullback within an uptrend, not a break in the trend by itself.
As shown in the chart, the price is above the middle Bollinger Band, while the upper band at $1,181.24 sits near the 20-day resistance. Bollinger Bands plot a moving average and price boundaries around it; a reading of 76% on the band scale places the price in the upper portion of its recent range, without showing an extreme stretch.
3-month price action chart of BLK: price, SMA20/50, Bollinger, support & resistance.
Oscillators & Momentum
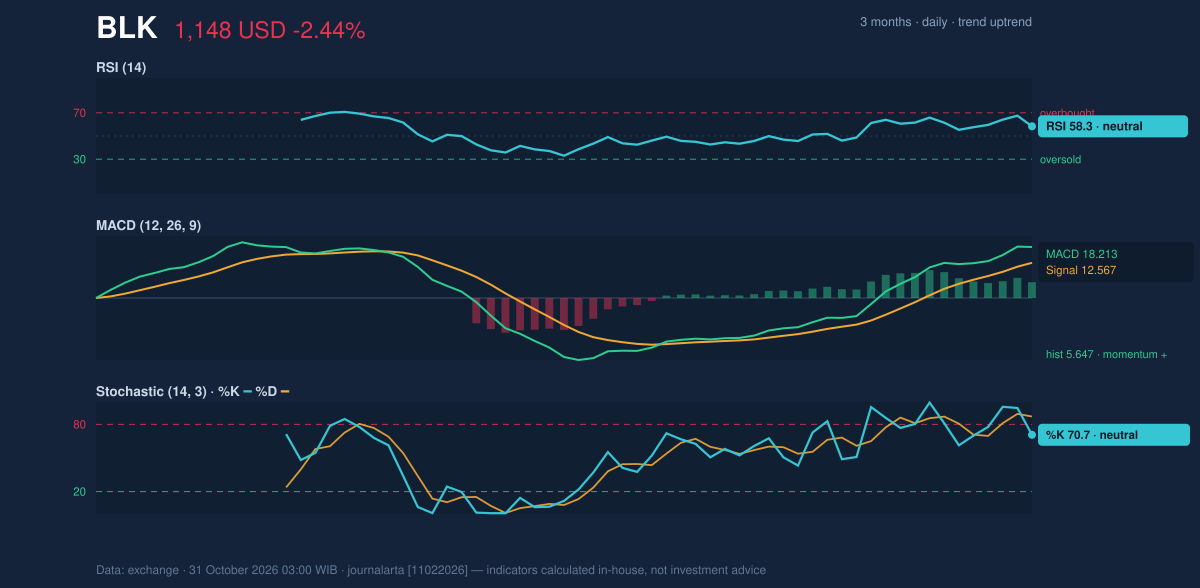
Momentum indicators lean positive, but do not all point with equal force. MACD is above its signal line, with a positive histogram of 5.647, indicating that upward momentum remains in place. The Relative Strength Index (RSI), a gauge of recent buying and selling pressure, is 58.3—neutral territory rather than an overbought reading.
The stochastic oscillator is also labelled neutral: %K is 70.7 and %D is 87.0. Its higher %D can signal that recent momentum is cooling, but the data does not establish a confirmed reversal. The technical-bias reading flags RSI rolling over from above 65 as its bearish signal, a counterweight to the golden cross and the broader trend.
The chart shows the RSI, MACD and stochastic readings together, making the split visible: MACD remains positive, while the oscillators counsel caution.
Momentum chart of BLK: RSI(14), MACD, Stochastic.
Volatility, Volume & Levels
Volatility is moderate. Average True Range, or ATR, is $29.33, equivalent to 2.6% of the price; ATR estimates typical movement rather than direction. The Bollinger Band width is 12.4%, classified as normal, so the data shows neither an unusually tight setup nor a sharp expansion in price swings.
Participation was subdued during the decline. Volume was 644,700 shares, or 0.9 times the 20-session average of 687,450. That is thin relative to normal activity, which makes the sell-off less clearly confirmed by trading participation. Meanwhile, On-Balance Volume (OBV), which tracks whether volume accompanies rising or falling prices, is rising. Together, these readings support the uptrend but leave the latest one-day drop unresolved.
The first test on a rebound is $1,176.24, the 20-day resistance; beyond it, the three-month high at $1,187.17 is the next reference. A failure to hold the short-term averages would put $1,103.80–$1,112.30 in focus, with the deeper 20-day support at $1,065.35. A break below that support would invalidate the bullish technical case used here.
Technical Verdict: BUY
The verdict follows the supplied bullish technical bias, not the one-day price move alone. The strongest supporting signals are the golden cross formed one session before the latest session, the price holding above both moving averages in an uptrend, and rising OBV. The counter-signal is RSI rolling over from above 65, while below-average volume limits confirmation of the latest decline. The verdict is invalidated if price falls below $1,065.35, the 20-day support.
Ideal entry range: $1,112.30–$1,147.54, spanning the 20-day average to the latest close.
Exit target: $1,176.24, the next 20-day resistance.
Stop-loss protection: $1,065.35, below the 20-day support.
In plain English, the chart still favours an upward trend, but the price has not yet cleared its nearest resistance.
Metric
Reading
Latest price
$1,147.54
One-day / five-day / one-month change
-2.44% / +2.62% / +8.30%
SMA20 / SMA50
$1,112.30 / $1,103.80
RSI / MACD histogram
58.3 / 5.647
20-day support / resistance
$1,065.35 / $1,176.24
Summary Data BLK
Last price
1,147.54 USD
Change 1 day / 5 days / 1 month
-2.44% / 2.62% / 8.30%
Trend / MA-cross
uptrend / golden
SMA20 / SMA50
1,112.30 / 1,103.80
RSI (14) / Stochastic %K
58.3 / 70.7
Bollinger %B / ATR
76% / 29.33
Support / Resistance 20 days
1,065.35 / 1,176.24
Data as of
31 October 2026 03:00 WIB
Disclaimer: This technical analysis is generated automatically from exchange data and indicators calculated by JournalArta, for information and education only. The verdict and the entry, target and stop-loss levels are not investment advice or a solicitation to buy or sell any security. Investment decisions and their risks rest solely with the reader.