AIG Testing Key Resistance: Stock Gains 0.56% (October 30, 2026)
On October 30, 2026: price 81.90 USD, trend uptrend, RSI 63.8, support 75.11, resistance 83.03. technical analysis of aig stock. AIG Testing Key Resistance —…

Why AIG is in focus today
- Trading near its 3-month high (83.07)
- Not covered by JournalArta in the last 14 days
Selected automatically from 80 NYSE (US) stocks by a technical-signal score with daily weighted randomisation — not a recommendation.
Trend & Price Action
AIG remains in an uptrend, with its price above both the 20-day simple moving average, at $79.26, and the 50-day average, at $77.07. The 20-day average rose 2.00% over five days, a sign that the shorter-term trend is strengthening. There was no new moving-average crossover, however, so the latest data do not show a fresh shift in the relationship between short- and longer-term trends. The stock gained 0.79% over five days and 9.30% over one month. It is now near the three-month high of $83.07, with the 20-day resistance at $83.03. At 86% of its 20-day range, the price has already covered much of the recent ground from support; further progress depends on whether it can clear that nearby ceiling. The Bollinger Band position reinforces the picture of a stock approaching resistance, not one already breaking out: AIG’s %B reading is 77%, between the middle band at $79.26 and upper band at $84.09. The band width of 12.2% is normal rather than unusually compressed, so the data do not point to a volatility squeeze that might precede a sharp move.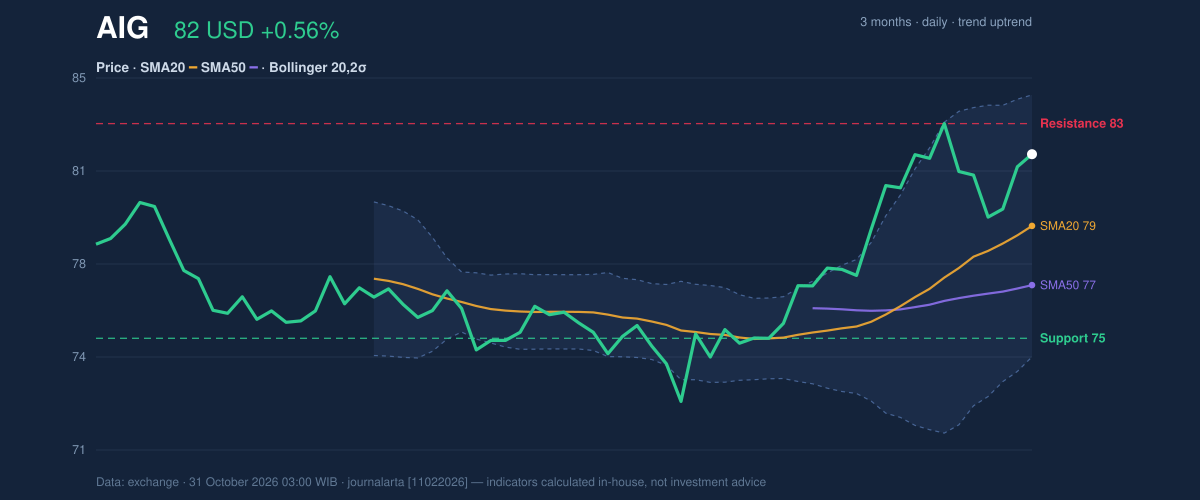
Oscillators & Momentum
Momentum is positive but not uniformly strong. The MACD is above its signal line, with a histogram of 0.094, indicating that the trend-following measure still favors upward momentum. The RSI is 63.8, in neutral territory: it is firm, but not at a level that by itself signals an overbought market. The Stochastic reading tells a more cautious short-term story. At %K 82.2 and %D 69.7, it is overbought, meaning the recent advance has been rapid relative to the stock’s recent trading range. That does not establish that a reversal is under way, but it raises the risk of a pause or pullback as AIG tests resistance.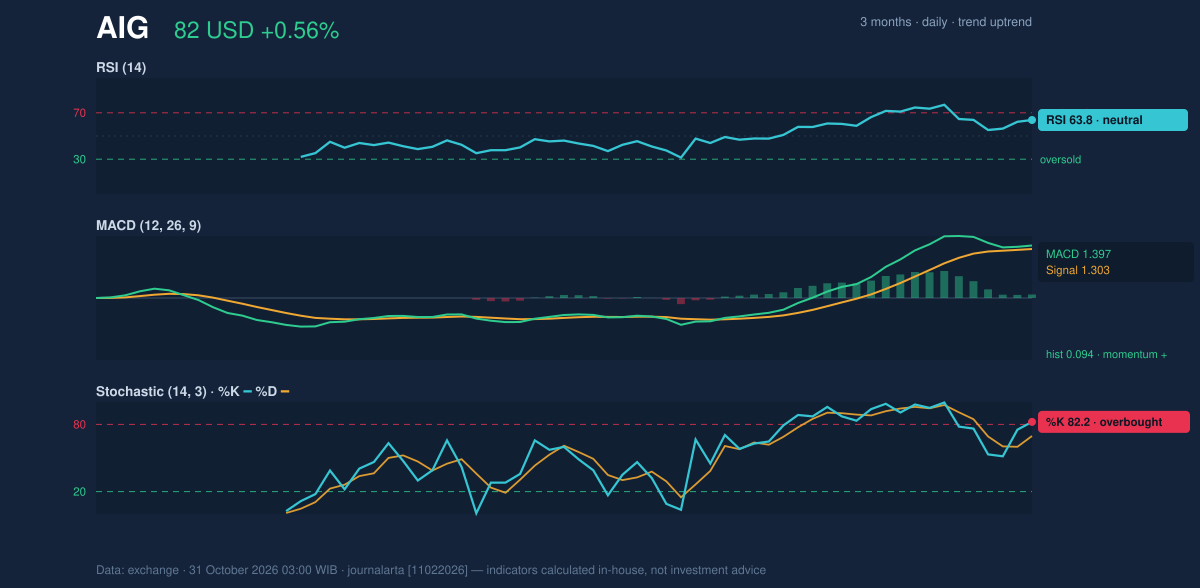
Volatility, Volume & Key Levels
Average true range, a measure of typical price movement, stands at $1.42, or 1.7% of the share price, indicating moderate volatility. That context helps frame the gap between current trading and nearby levels: the 20-day resistance at $83.03 is close, while the 20-day support at $75.11 is much farther below. Volume was 3,125,600 shares, about 0.8 times the 20-day average of 4,143,975, while OBV was falling. Together, those readings suggest that buying interest has not broadly confirmed the price rise. A sustained move above $83.03 and the three-month high of $83.07 would offer clearer evidence that demand is overcoming that hesitation. Failure to hold the 20-day average at $79.26 would weaken the near-term price structure; the lower support at $75.11 is a more consequential reference if selling deepens.Technical Verdict: HOLD
The technical bias is neutral, with none of the seven tracked signals classified as bullish or bearish. AIG’s position above both moving averages and positive MACD support the uptrend, but the overbought Stochastic, below-average volume and declining OBV argue against treating the approach to resistance as a confirmed breakout. - Ideal entry range: $79.26–$81.90, framed by the 20-day average and latest price; this is a technical reference range, not a recommendation. - Exit target: $83.03–$83.07, the 20-day resistance and three-month high. - Stop-loss protection: $79.77, the price minus 1.5 times ATR; a fall below the 20-day support at $75.11 would invalidate the neutral setup more decisively. For non-traders, HOLD means the chart shows an upward trend but not enough confirmation to resolve whether AIG can clear its nearby ceiling.Summary Data AIG
| Last price | 81.90 USD |
| Change 1 day / 5 days / 1 month | 0.56% / 0.79% / 9.30% |
| Trend / MA-cross | uptrend / none |
| SMA20 / SMA50 | 79.26 / 77.07 |
| RSI (14) / Stochastic %K | 63.8 / 82.2 |
| Bollinger %B / ATR | 77% / 1.42 |
| Support / Resistance 20 days | 75.11 / 83.03 |
| Data as of | 31 October 2026 03:00 WIB |
Disclaimer: This technical analysis is generated automatically from exchange data and indicators calculated by JournalArta, for information and education only. The verdict and the entry, target and stop-loss levels are not investment advice or a solicitation to buy or sell any security. Investment decisions and their risks rest solely with the reader.
Track AIG stock price daily: live levels, support/resistance and our full AIG analysis history.