AMT Stock Technicals: Gains 1.02% on Friday, Golden Cross Formed
On October 30, 2026: price 187.78 USD, trend uptrend, RSI 61.9, support 162.26, resistance 188.97. technical analysis of amt stock. AMT Stock Technicals — full…

Trend & Price Action
The golden cross is constructive, but its timing matters: it formed four sessions before the latest session, not on Friday. The stock’s position above both averages supports the uptrend, while the recent pullback toward the 20-day average is consistent with a test of shorter-term support rather than a breakdown. The price is now at 96% of its 20-day range, however, making the nearby resistance at US$188.97 an immediate hurdle. As shown in the chart, the share price sits above its moving averages while approaching the upper part of its recent range.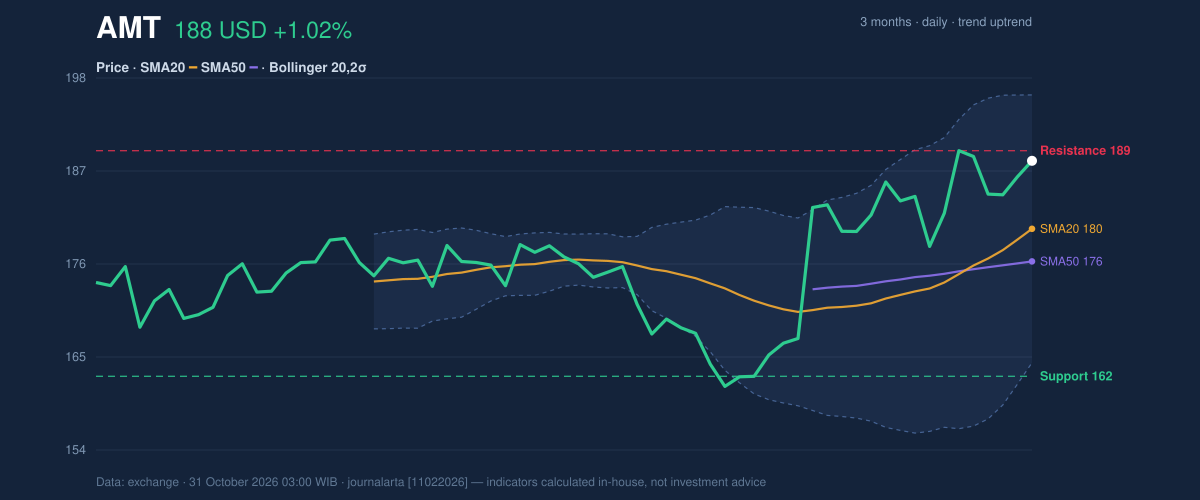
Oscillators & Momentum
Momentum readings broadly support, but do not yet strongly confirm, the price trend. The RSI is neutral at 61.9; it is below the commonly watched overbought zone, though the technical signal notes that RSI has rolled over from above 65. That easing is a caution, not by itself evidence that the uptrend has ended. The Stochastic reading is also neutral, with %K at 44.9 and %D at 38.2, indicating neither a pronounced overbought nor oversold condition. MACD remains positive: its reading of 3.751 is above the 3.163 signal line, with a positive histogram of 0.587. In plain terms, the indicator still shows upward momentum, although it does not erase the RSI’s loss of heat. The chart brings those mixed signals together: positive MACD alongside neutral RSI and Stochastic readings.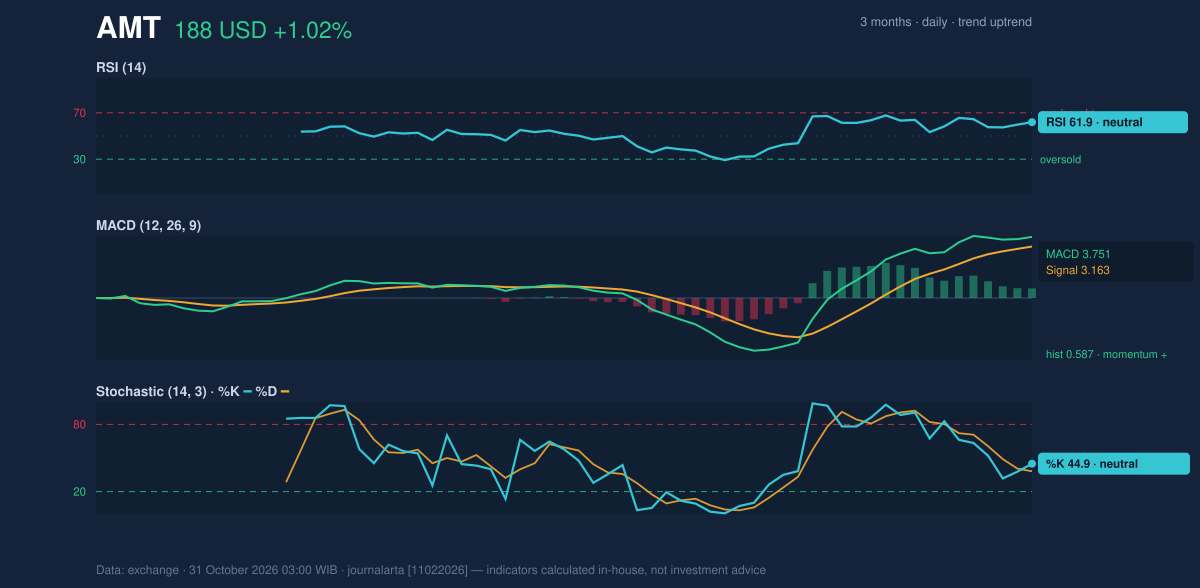
Volatility & Volume
AMT’s Bollinger bands are at normal width, not unusually compressed or expanded. The price is within the bands at 75% of the distance from the lower band to the upper one, with the upper boundary at US$195.58 and the lower at US$163.87. That positioning is consistent with a rising share price that has not yet reached the band’s upper edge. The 14-day average true range, a measure of typical daily price movement, is US$6.19, or 3.3% of the share price—moderate volatility rather than a signal of exceptional swings. Volume was 3,113,000 shares, about 0.8 times the 20-day average of 3,690,080. The advance therefore came without above-average participation in the latest session. On the other hand, rising on-balance volume (OBV)—a running measure that adds volume on rising days and subtracts it on falling days—suggests buying participation has been building over time. That is a supportive trend signal, though thin session volume makes the latest move less emphatic.Technical Verdict: BUY
The technical bias is bullish, supported by the golden cross, the price holding above both moving averages, and rising OBV. Positive MACD adds confirmation, while the RSI’s retreat from above 65 and below-average volume are cautions. The verdict would be invalidated if AMT falls below the US$162.26 20-day support.- Ideal entry range: US$179.72–US$188.97, bounded by the 20-day average and 20-day resistance.
- Exit target: US$202.50, the three-month high, if the price breaks above US$188.97.
- Stop-loss reference: US$178.49, the price minus 1.5 times ATR; a close below this level would weaken the short-term setup.
Data source: market data for the Friday, October 30, 2026, trading session.
Why AMT is in focus today
- Fresh golden cross: SMA20 crossed above SMA50
- Not covered by JournalArta in the last 14 days
Selected automatically from 80 NYSE (US) stocks by a technical-signal score with daily weighted randomisation — not a recommendation.
Summary Data AMT
| Last price | 187.78 USD |
| Change 1 day / 5 days / 1 month | 1.02% / -0.63% / 15.77% |
| Trend / MA-cross | uptrend / golden |
| SMA20 / SMA50 | 179.72 / 175.87 |
| RSI (14) / Stochastic %K | 61.9 / 44.9 |
| Bollinger %B / ATR | 75% / 6.19 |
| Support / Resistance 20 days | 162.26 / 188.97 |
| Data as of | 31 October 2026 03:00 WIB |
Disclaimer: This technical analysis is generated automatically from exchange data and indicators calculated by JournalArta, for information and education only. The verdict and the entry, target and stop-loss levels are not investment advice or a solicitation to buy or sell any security. Investment decisions and their risks rest solely with the reader.
Track AMT stock price daily: live levels, support/resistance and our full AMT analysis history.