Testing Support Level, SNOW Stock Drops 7.32% on Friday
On October 30, 2026: price 306.08 USD, trend sideways, RSI 39.7, support 306.08, resistance 368.89. technical analysis of snow stock. Testing Support Level —…

Why SNOW is in focus today
- One-day move of -7.32%, about 1.2× its average daily range (ATR)
- Volume at 1.8× the 20-day average
- MACD histogram has just turned negative
- Not covered by JournalArta in the last 14 days
Selected automatically from 80 NYSE (US) stocks by a technical-signal score with daily weighted randomisation — not a recommendation.
Trend & Price Action
At $306.08, Snowflake is below both its 20-day moving average of $333.05 and its 50-day average of $332.03. The two averages are close together, but there has been no new crossing between them. The 20-day average itself fell 0.48% over five days, consistent with a sideways trend that has tilted weaker rather than a clear upward turn. The share price sits at the bottom of its stated 20-day range, with support at $306.08 and resistance at $368.89. It is also closer to the three-month low of $292.63 than the high of $384.56. A close below the moving averages, alongside a test of range support, leaves the near-term price structure vulnerable. The price chart shows the relationship between the share price, its moving averages, Bollinger Bands and key support and resistance levels.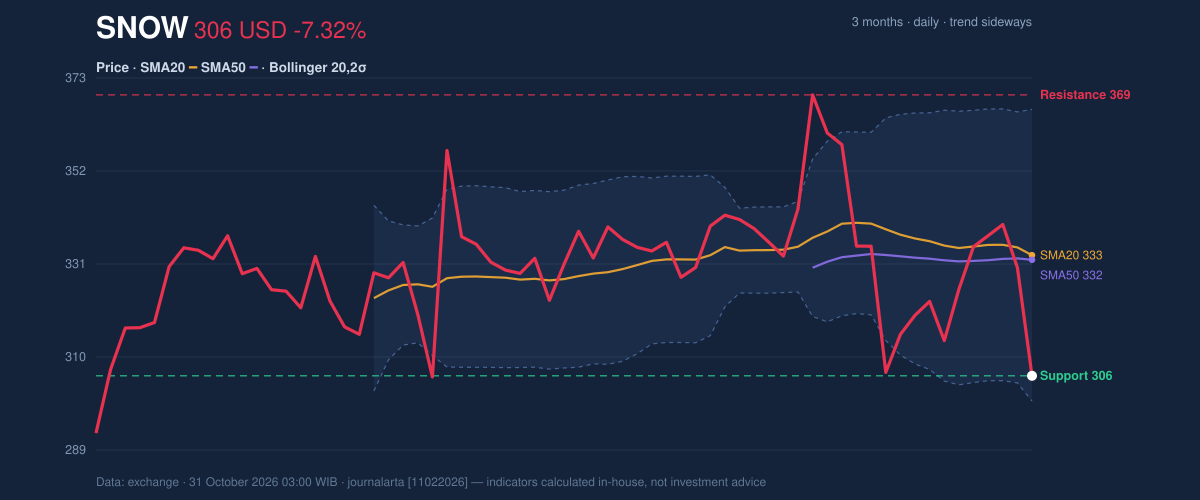
Oscillators & Momentum
Momentum indicators reinforce the pressure, though they differ on how stretched the decline has become. The RSI, a measure of recent price momentum, is 39.7, which is classified as neutral in the supplied data. The Stochastic indicator, which compares the latest price with its recent trading range, is in oversold territory: %K is 14.7 and %D is 37.0. Oversold readings can accompany a continuing fall; by themselves, they do not confirm a rebound. The MACD, a trend-and-momentum measure, is negative at -2.821 against a signal line of -1.322, with its histogram at -1.500. The histogram’s turn negative marks a deterioration in momentum, not proof that a recovery is impossible. Its significance is greater alongside the high-volume drop and the price’s position below both moving averages. The momentum chart displays RSI, MACD and Stochastic readings.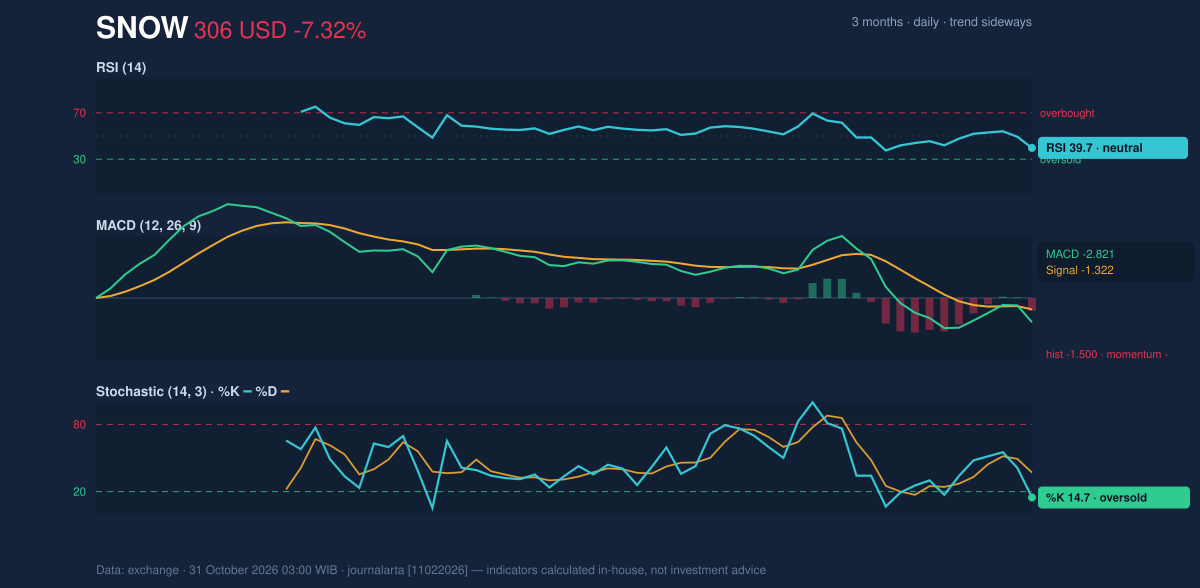
Volatility, Volume & Key Levels
Snowflake traded 7,748,100 shares, against a 20-day average of 4,309,440. That 1.8-times volume surge indicates unusually strong participation in the decline. On the other hand, OBV, or on-balance volume—a running measure that adds or subtracts volume according to price direction—was rising. This is a counter-signal: it complicates the bearish reading but does not erase the session’s heavy selling or the negative MACD histogram. The Bollinger Bands, which measure how far prices are moving from a recent average, run from $300.44 at the lower band to $365.65 at the upper band. The share’s %B reading is 9%, placing it close to the lower edge; the band width of 19.6% is described as normal, rather than a squeeze or unusually wide expansion. Price is pressing the lower band, but the bands do not show a volatility squeeze that would signal compression before a larger move. The immediate test is whether $306.08 support holds. A sustained break below it would expose the three-month low at $292.63; a deeper risk reference is $278.79, calculated as the last price minus 1.5 times ATR. On a recovery, $333.05—the 20-day average—is an initial reference point, while $368.89 is the stated 20-day resistance. The three-month high is $384.56.Technical Verdict: SELL
The technical bias is bearish, with three bearish signals and no bullish signals in the supplied assessment. The strongest reasons are the close below the 20-day support on volume at least 1.5 times average, the MACD histogram’s turn negative, and the price’s position below the 50-day average during a downtrend. The oversold Stochastic and rising OBV are counter-signals, but neither yet overturns that combination. The verdict is invalidated if the price breaks above the $368.89 20-day resistance.- Ideal entry range: $306.08–$333.05, using the stated support and 20-day average as reference levels.
- Exit target: $292.63, the three-month low and next lower reference below 20-day support.
- Stop-loss protection: $368.89, above the 20-day resistance.
| Item | Reading |
|---|---|
| Latest price | $306.08 |
| Session | Friday, October 30, 2026 |
| One-day change | -7.32% |
| Volume | 7,748,100; 1.8× 20-day average |
| 20-day support / resistance | $306.08 / $368.89 |
| Three-month low / high | $292.63 / $384.56 |
Summary Data SNOW
| Last price | 306.08 USD |
| Change 1 day / 5 days / 1 month | -7.32% / -5.95% / -10.25% |
| Trend / MA-cross | sideways / none |
| SMA20 / SMA50 | 333.05 / 332.03 |
| RSI (14) / Stochastic %K | 39.7 / 14.7 |
| Bollinger %B / ATR | 9% / 18.20 |
| Support / Resistance 20 days | 306.08 / 368.89 |
| Data as of | 31 October 2026 03:00 WIB |
Disclaimer: This technical analysis is generated automatically from exchange data and indicators calculated by JournalArta, for information and education only. The verdict and the entry, target and stop-loss levels are not investment advice or a solicitation to buy or sell any security. Investment decisions and their risks rest solely with the reader.
Track SNOW stock price daily: live levels, support/resistance and our full SNOW analysis history.