Tencent Stock Gains 5.50% Today, Momentum Weakens
On Juli 31, 2026: price 471.80 HKD, trend uptrend, RSI 54.5, support 430.20, resistance 484.00. technical analysis of tencent stock. Tencent Stock Gains — full…

Tencent Holdings traded on HKEX in Hong Kong at 471.80 HKD after a 5.50% one-day rise, putting the stock back above its short-term trend markers and closer to the top of its recent trading range, according to exchange-based data cited via Yahoo Finance. The move matters because it is not just a rebound in price: it shows Tencent is still being bought while the broader trend remains upward, even as some momentum gauges are no longer fully aligned.
Trend & Price Action
The first signal in the chart is straightforward: Tencent is trading above its SMA20 at 457.27 and also above its SMA50 at 449.01, which keeps the stock in an established uptrend rather than a breakdown pattern. The SMA20 slope of 1.38% over 5 days suggests the short-term trend is still rising, meaning recent price action has been constructive rather than flat. There is no fresh MA-cross, so the market is not getting a new trend confirmation from the moving averages; instead, it is extending an existing one.
That distinction matters. When a stock is already above both key averages, the question is no longer whether the trend exists, but whether buyers are still strong enough to defend it.
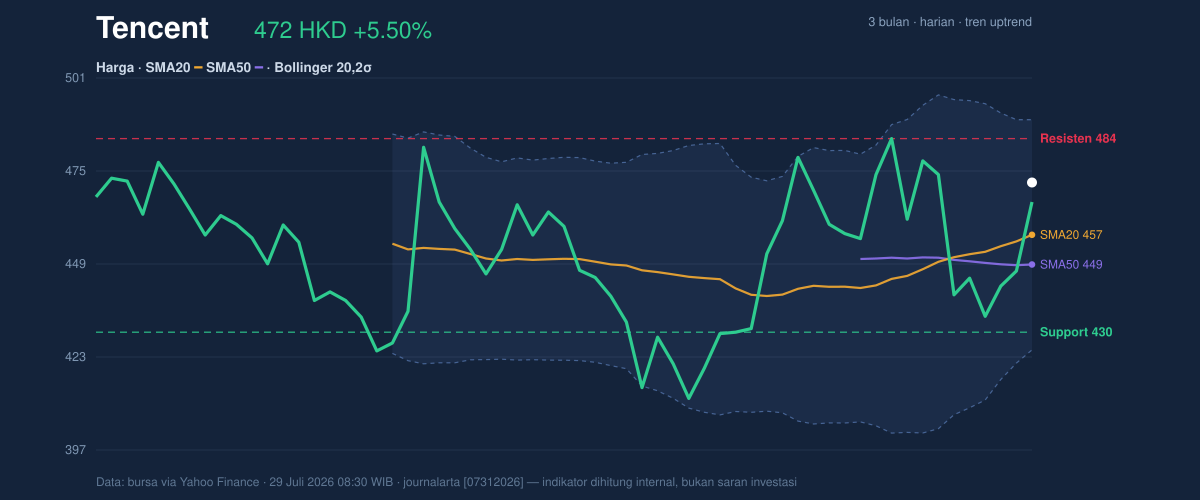
Tencent is also trading at 77% of its 20-hour range, with support at 430.20 and resistance at 484.00. In plain English, the stock is nearer the upper end of its recent corridor than the lower end, which usually signals that sellers have not yet regained control. The broader three-month band — 494.80 on the high side and 411.00 on the low side — shows the current price is approaching the upper part of that larger range, but not yet testing the ceiling.
Oscillators & Momentum
The momentum picture is more mixed than the trend picture. The RSI at 54.5 is neutral, which means Tencent is neither stretched on the upside nor washed out on the downside. That is usually a sign of balance: the stock has room to move either way, but it is not flashing an overbought warning.
The Stochastic %K at 54.8 and %D at 32.2 is also neutral, though the gap between the two lines suggests short-term momentum has improved enough to lift %K above %D. That can be read as early recovery strength, but not yet a decisive acceleration. The more important caution comes from the MACD: at 1.039, it remains positive, but it sits below the signal line at 2.236, with a histogram of -1.197. That negative histogram tells readers that upside momentum is currently lagging the trend, even if the stock itself is still rising.
In other words, Tencent is climbing, but the engine is not revving as hard as the price chart alone might suggest.
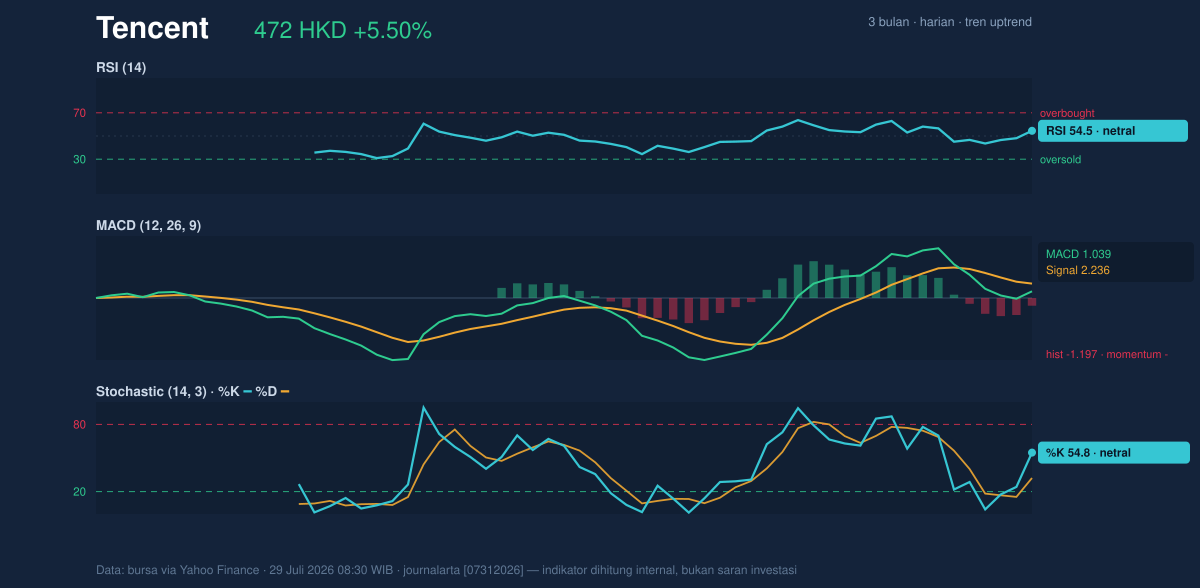
This kind of setup often appears when a stock is consolidating gains inside an uptrend: price can stay firm while momentum indicators cool off. The risk is not immediate reversal; the risk is that the rally loses urgency if the MACD gap persists.
Volatility & Volume
Bollinger Bands help frame how extended the move is. Tencent’s %B at 73% places the price in the upper portion of the band structure, but not at the extreme top. The upper band at 489.27 is the next technical ceiling visible on the chart, while the middle band at 457.27 lines up exactly with the SMA20, reinforcing that area as a key pivot. The band width of 14.0% is described as normal, which means the stock is not in a volatility squeeze or a breakout-style expansion. That matters because normal band width often implies the market is still digesting the prior move rather than preparing for a dramatic price shock.
The ATR(14) at 17.83, equal to 3.8% of price, says daily swings remain relatively large. In practical terms, Tencent can move meaningfully in either direction without violating the broader trend, so traders watching the chart should expect noise around the trend rather than a smooth line upward.
Volume offers a partial confirmation. Last volume was 36,203,193, slightly above the 20-hour average of 34,891,086, or about 1.0× normal. That is not a surge, but it is enough to show participation has not dried up. The OBV is rising, which is the cleaner signal here: on-balance volume tracking higher suggests buyers have been accumulating shares over time, even if the most recent session was not a volume blowout.
Key Levels & Scenarios
The chart points to a fairly clear map. Resistance at 484.00 is the nearest level to watch, and it sits just below the upper Bollinger band at 489.27. If Tencent can push through that zone, the price would be testing the upper end of both its short-term range and its band structure. On the downside, support at 430.20 is the first clear floor, followed by the SMA20 at 457.27 as an intermediate support and trend marker.
If price holds above the mid-band and SMA20, the uptrend remains intact. If it slips back below the SMA20 and fails to recover, the market is telling you the recent advance is losing commitment. If it breaks 430.20, the chart would start to look more fragile, because that would mean the stock has fallen out of its recent support zone and closer to the lower half of the broader range.
Technical Verdict: HOLD (wait & see)
HOLD (wait & see) fits the current setup because Tencent is still in an uptrend, but momentum is no longer fully confirming the price move.
- Reason 1: Trend support remains positive — price is above SMA20 457.27 and SMA50 449.01, with a rising SMA20 slope.
- Reason 2: Momentum is mixed — RSI 54.5 and Stochastic 54.8/32.2 are neutral, while MACD 1.039 sits below its signal 2.236 and the histogram -1.197 is negative.
- Reason 3: Price is near the upper part of its range — %B 73%, resistance 484.00, and upper band 489.27 leave less room before the chart meets overhead supply.
- Verdict invalidated if price breaks below 430.20, because that would mean the recent support shelf has failed.
- Ideal Entry Range: 457.27 to 471.80, where the SMA20 and current price create the clearest trend reference.
- Exit Target: 484.00 to 489.27, aligned with resistance and the upper Bollinger band.
- Stop Loss protection: below 430.20, the nearest support level on the chart.
For non-traders, this means Tencent still looks technically healthy, but the chart is asking for confirmation before the next leg higher is trusted. “The trend is alive, but the momentum is not yet shouting.”
Summary Data Tencent
| Last price | 471.80 HKD |
| Change 1 day / 5 days / 1 month | 5.50% / 7.08% / 9.77% |
| Trend / MA-cross | uptrend / none |
| SMA20 / SMA50 | 457.27 / 449.01 |
| RSI (14) / Stochastic %K | 54.5 / 54.8 |
| Bollinger %B / ATR | 73% / 17.83 |
| Support / Resistance 20 days | 430.20 / 484.00 |
| Data as of | 29 Juli 2026 08:30 WIB |

