HSBC Momentum Gains: Stock Gains 0.51% (September 15, 2026)
On September 15, 2026: price 1,536.80 GBp, trend uptrend, RSI 54.6, support 1,497.20, resistance 1,580.20. technical analysis of hsbc stock.

At 1,536.80 GBp, HSBC Holdings is trading just above its short-term trend line, with the share price sitting a touch over the SMA20 at 1,534.96 and comfortably above the SMA50 at 1,522.94, according to data from Yahoo Finance via the London Stock Exchange. That matters because it shows the stock is still leaning upward even after a -2.75% five-day pullback: the recent dip has not yet broken the broader pattern of higher short-term support. The market is also reading the move as orderly rather than impulsive, with Bollinger Bands tightening and momentum indicators sitting in neutral-to-positive territory.
Trend & Price Action
The chart shows HSBC in an uptrend, but one that is still being tested rather than celebrated. Price is above the SMA20 and above the SMA50, which signals that buyers have so far defended the recent trend structure. The absence of a new MA-cross means there is no fresh trend reversal signal to anchor a stronger directional call; instead, the market is working off the existing trend. The slope of the SMA20 at 0.46% over 5 days is modest, which suggests the advance is intact but not accelerating. In plain terms, HSBC is rising, but not with enough force to imply a breakout has already begun.
The price is positioned around the middle of its recent trading band, at 48% of the range, which leaves room in either direction. The 3-month high at 1,610.00 remains the obvious ceiling, while the 3-month low at 1,350.00 marks the broader floor. That wide range tells us the stock has already proven it can move meaningfully when conditions change; the current question is whether the latest consolidation resolves into another leg higher or simply stalls near resistance.
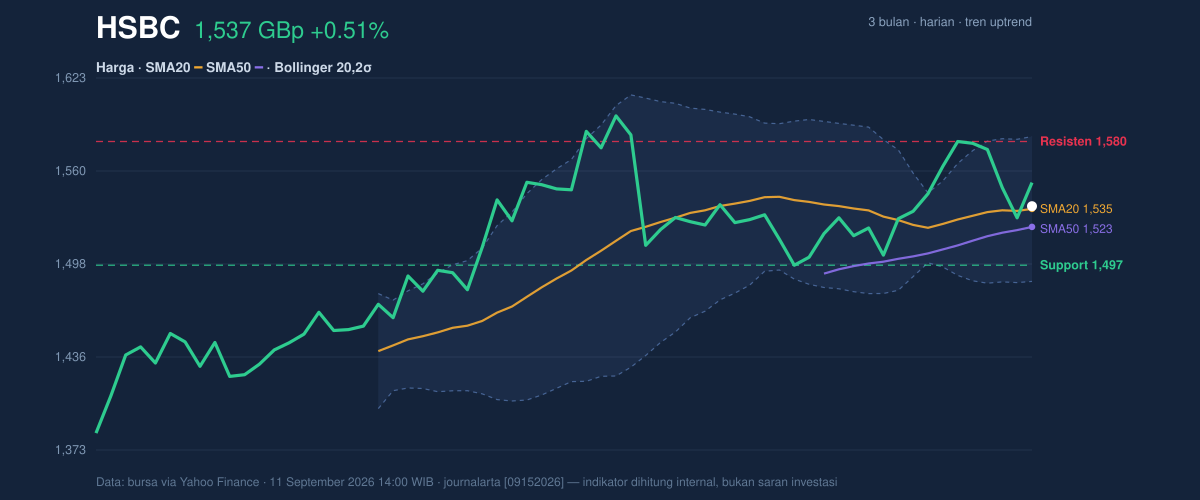
Support at 1,497.20 is the key near-term level to watch, because a break below it would mean the current trade is no longer just a shallow pause. On the upside, resistance at 1,580.20 is the first test that matters: it sits below the upper Bollinger Band at 1,583.54, so a push through that area would suggest the stock is moving from consolidation toward expansion.
Oscillators & Momentum
The momentum picture is mixed, but not weak. The RSI at 54.6 is neutral, which means HSBC is neither overbought nor oversold. That is important because it leaves scope for price to move without immediately running into an exhausted momentum reading. The Stochastic %K at 61.3 and %D at 51.6 also sit in neutral territory, but with %K above %D, the short-term momentum bias is improving. This is not a roaring signal; it is a quiet one. The market is leaning upward, but it has not yet committed to a strong directional burst.
The cleaner read comes from MACD. With MACD at 10.335 above the signal line at 10.116, and a positive histogram of 0.219, the trend is still being supported by underlying momentum. In technical terms, the histogram measures the gap between MACD and its signal line; a positive reading means momentum is currently helping price rather than fighting it. That is why the recent five-day weakness looks more like a pause inside an existing trend than the start of a full reversal.
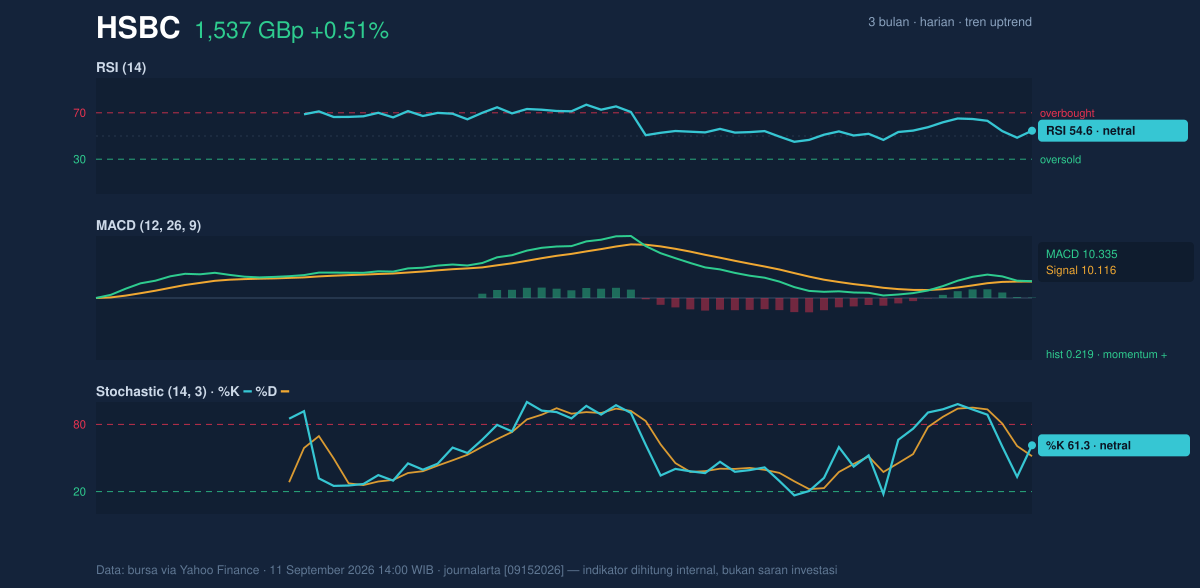
RSI is neutral, Stochastic is neutral, and MACD remains positive — a combination that usually points to consolidation with an upward bias rather than a decisive breakout already in motion.
Volatility & Volume
Bollinger Bands are telling the market’s most interesting story right now. The band width of 6.3% is relatively tight and is described in the data as a squeeze, which often means volatility is compressing before a larger move. A squeeze does not predict direction by itself, but it does warn that the current calm may not last. With price sitting near the middle of the bands and the %B at 52%, HSBC is not pressing the upper edge of its range yet; it is balanced, waiting for a catalyst.
That interpretation is reinforced by volume. The latest turnover of 9,108,205 is well below the 20-day average of 17,440,496, or about 0.5× normal activity. Thin volume matters because it means the latest price move has not been strongly confirmed by broad participation. Yet the OBV is rising, which suggests the cumulative flow of volume still favors accumulation even if the most recent session was quiet. In other words, the market is not showing panic selling; it is showing a lack of urgency, with underlying demand still present.
ATR at 28.81, or 1.9% of price, points to moderate volatility. That means the stock is moving enough to matter, but not so violently that every session is likely to rewrite the chart. For traders reading the setup, this is the sort of environment where a breakout can develop quickly once volume returns — but only if the price first escapes the current band.
Key Levels & Scenarios
Resistance at 1,580.20 and the upper Bollinger Band at 1,583.54 form the first upside gate. If HSBC clears that zone with stronger participation, the chart would open space toward the 3-month high at 1,610.00. On the downside, support at 1,497.20 is the level that keeps the short-term structure intact; a failure there would weaken the case that the current move is merely consolidative. The SMA20 at 1,534.96 is the immediate pivot, because price is trading just above it. Staying above that line keeps the trend constructive; slipping below it would make the market look less like a controlled pause and more like a drift back toward support.
Technical Verdict: HOLD (wait & see)
HOLD (wait & see) is the clearest technical verdict because the chart is constructive, but not yet decisive.
- MACD is positive and the histogram remains above zero, which supports the existing uptrend.
- Price is above the SMA20 and SMA50, so the trend structure has not broken.
- Bollinger Bands are squeezing, which signals a potential move, but not yet a confirmed direction.
Verdict invalidated if price falls below 1,497.20, because that would break the nearest support and weaken the short-term trend.
- Ideal Entry Range: 1,534.96 to 1,497.20
- Exit Target: 1,580.20 to 1,583.54, with 1,610.00 as the next chart reference if that zone gives way
- Stop Loss protection: below 1,497.20
In plain English: HSBC is holding its trend, but the chart wants confirmation before it shows its next move.
HSBC’s latest close remains above the SMA20 at 1,534.96 and just below resistance at 1,580.20.
Summary Data HSBC
| Last price | 1,536.80 GBp |
| Change 1 day / 5 days / 1 month | 0.51% / -2.75% / 0.72% |
| Trend / MA-cross | uptrend / none |
| SMA20 / SMA50 | 1,534.96 / 1,522.94 |
| RSI (14) / Stochastic %K | 54.6 / 61.3 |
| Bollinger %B / ATR | 52% / 28.81 |
| Support / Resistance 20 days | 1,497.20 / 1,580.20 |
| Data as of | 11 September 2026 14:00 WIB |

