Shell Stock Analysis: Gains 1.39%, Testing Key Resistance
On September 15, 2026: price 3,582.00 GBp, trend uptrend, RSI 69.8, support 3,311.00, resistance 3,551.00. technical analysis of shell stock.

Shell plc climbed on the LSE in London on 11 September 2026, with the share price rising to 3,582.00 GBp from 3,533.00 at the previous close, a move that leaves the stock pressing against the upper edge of its recent trading range. The advance matters because it is not happening in isolation: Shell is trading above its short- and medium-term trend lines, but the latest momentum readings also show the shares are getting stretched, which often turns a clean trend into a test of conviction.
Trend & Price Action
The broader message from the chart is constructive. Shell remains in an uptrend, and the price is sitting above both the SMA20 at 3,421.63 and the SMA50 at 3,300.11, which tells traders the market has been willing to pay progressively higher prices over the past few weeks. The SMA20 slope of 1.53% over 5 days reinforces that the short-term trend is still rising rather than flattening out.
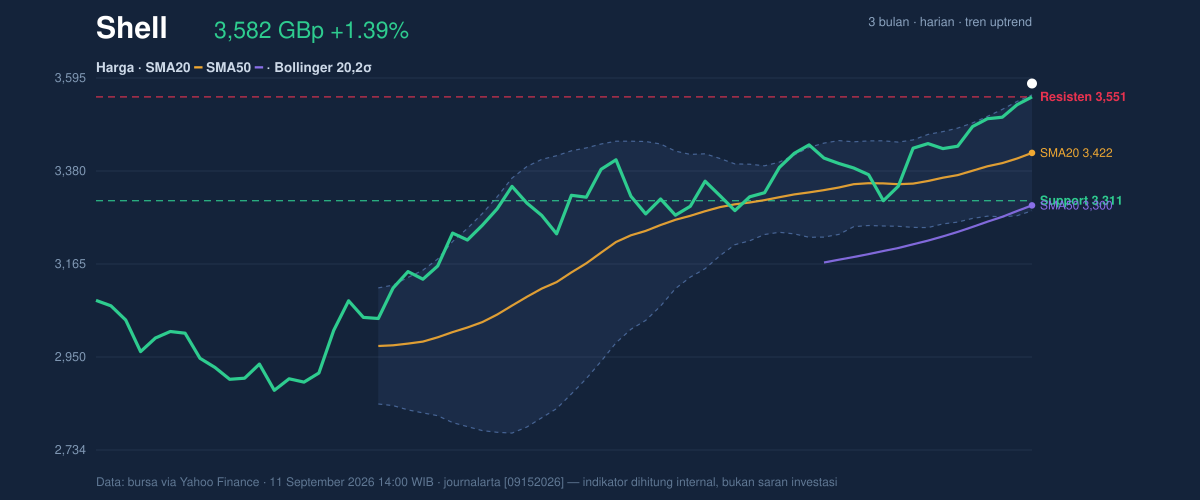
What makes this more interesting is where the share price now sits inside that structure. At 3,582.00 GBp, Shell is above the stated 20-hour resistance at 3,551.00 and near the 3-month high of 3,580.50. In plain English, the stock is trading at the top of its recent room to move, so the market is no longer asking whether the trend is improving; it is asking whether buyers can keep paying up after the easy gains. The 113% position within the 20-hour range underlines that it is already beyond the usual upper boundary, a sign of strength, but also of possible exhaustion if follow-through fades.
The Bollinger Bands tell a similar story. Price is above the upper band at 3,555.63, and %B at 110% means the share is trading beyond the band rather than comfortably inside it. That is often what a breakout looks like in its earliest phase, especially when the band width is only 7.8%, because a squeeze suggests the market had been compressed and may now be releasing that pressure. The signal is bullish, but it is also fragile: breakouts above a narrow band can either accelerate quickly or snap back just as fast.
Oscillators & Momentum
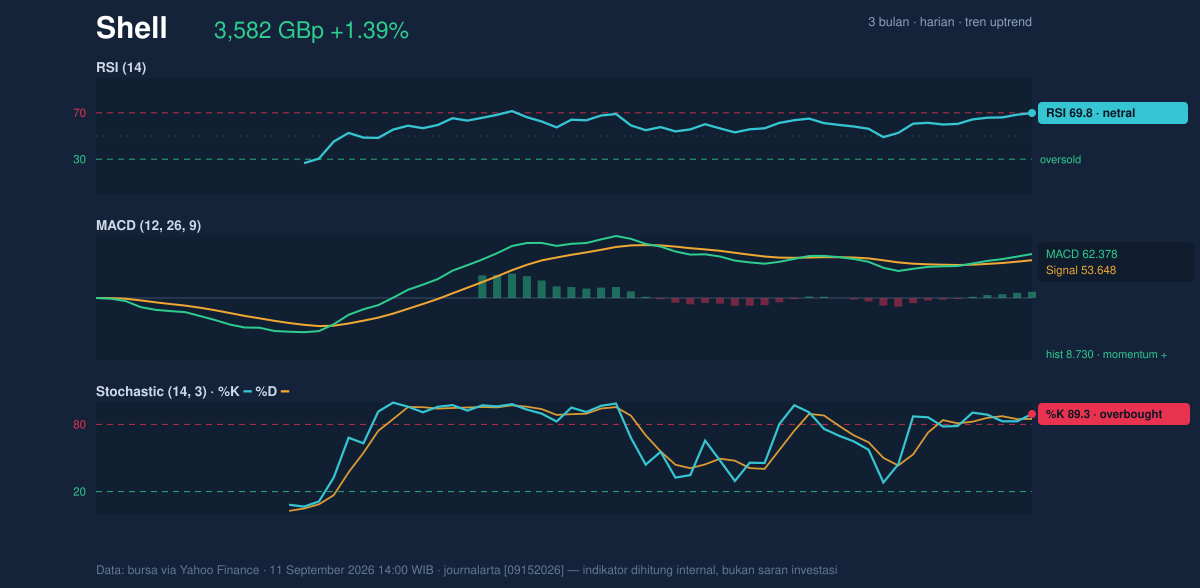
The momentum picture is positive, though not cleanly settled. The RSI(14) at 69.8 sits just below the classic overbought threshold, which means the stock is strong but not yet in the kind of extreme that usually forces an immediate reversal. That matters: RSI near 70 often says “buyers are still in control,” but it also warns that fresh upside may require more effort than before.
The Stochastic %K at 89.3 and %D at 84.9 are more stretched, and that is the sharper caution flag in this setup. Stochastic is a faster oscillator than RSI, so it tends to react sooner when price runs ahead of itself. Here, it is saying the stock is near the top of its recent momentum envelope, which fits the fact that Shell is already near a 3-month high.
At the same time, the MACD at 62.378 remains above the signal line at 53.648, with a positive histogram of 8.730. That combination is important because MACD is not just positive; it is still expanding in favor of the trend. In practical terms, the trend is not merely intact — it is still receiving confirmation from medium-term momentum. So while Stochastic warns of near-term overheating, MACD says the larger push has not yet broken down.
Volatility & Volume
Volatility is moderate rather than explosive. The ATR(14) of 57.18, equal to 1.6% of price, suggests the stock typically moves enough to create meaningful daily swings, but not so much that the chart is chaotic. That matters because a breakout above resistance needs room to breathe; ATR says Shell has enough movement capacity to extend, but not so much that every tick is noise.
Volume, however, is the one area that tempers the enthusiasm. Last session volume was 7,440,101, below the 20-day average of 10,672,973, or about 0.7× normal. That means the latest rise did not come with full market participation. Price has climbed, but the crowd has not yet fully joined in. The positive counterweight is that OBV is rising, which suggests the broader accumulation trend remains intact even if the most recent session was quieter than average. In other words, the market is leaning bullish, but it has not yet delivered the volume punch that would make the breakout feel unquestionable.
Key Levels & Scenarios
The nearest technical floor is the 20-hour support at 3,311.00. That is the line that would matter if the current breakout attempt loses momentum and sellers regain control. Below that, the SMA20 at 3,421.63 is the first trend gauge to watch on any pullback, because holding above it would keep the short-term uptrend intact.
On the upside, the immediate reference point is the 20-hour resistance at 3,551.00, now already cleared, while the next visible test is the current price zone around the 3-month high of 3,580.50. If Shell can hold above that area, the chart would be signaling that the recent squeeze has resolved upward rather than merely spiking.
The core message is that Shell’s trend remains bullish, but momentum is now stretched enough that the market needs confirmation, not just enthusiasm. A clean hold above the upper-band area would strengthen the breakout case; failure to do so would quickly shift attention back toward the SMA20 and then the lower support band.
Technical Verdict: HOLD (wait & see)
2–3 strongest reasons:
- MACD is positive and still above its signal line, which supports the underlying uptrend.
- Price is above SMA20 and SMA50, confirming the trend structure remains bullish.
- Stochastic is overbought and price is above the Bollinger upper band, which warns the move is extended and vulnerable to a pause.
Verdict invalidated if price breaks/falls below 3,311.00.
- Ideal Entry Range: 3,421.63 to 3,551.00
- Exit Target: 3,580.50
- Stop Loss protection: 3,311.00
In plain English: the chart still points upward, but after a strong run, the next move needs proof rather than assumptions.
“We’re not seeing weakness yet — but at this level, the market has to earn every extra tick.”
Summary Data Shell
| Last price | 3,582.00 GBp |
| Change 1 day / 5 days / 1 month | 1.39% / 4.22% / 8.94% |
| Trend / MA-cross | uptrend / none |
| SMA20 / SMA50 | 3,421.63 / 3,300.11 |
| RSI (14) / Stochastic %K | 69.8 / 89.3 |
| Bollinger %B / ATR | 110% / 57.18 |
| Support / Resistance 20 days | 3,311.00 / 3,551.00 |
| Data as of | 11 September 2026 14:00 WIB |

