AAPL Stock Analysis: Gains 1.48%, Testing Key Resistance
On October 29, 2026: price 348.91 USD, trend uptrend, RSI 60.7, support 332.89, resistance 348.91. technical analysis of aapl stock. AAPL Stock Analysis — full…
Why AAPL is in focus today
- Trading near its 3-month high (351.73)
- MACD histogram has just turned positive
Selected automatically from 32 NASDAQ (US) stocks by a technical-signal score with daily weighted randomisation — not a recommendation.
Trend & Price Action
The broader technical structure remains upward. Apple trades above its 20-day simple moving average of $341.54 and its 50-day average of $332.37, while the 20-day average rose 0.88% over five days. A simple moving average smooths daily price swings; a rising shorter-term average above the longer-term one generally reflects improving trend conditions. There has been no new moving-average crossover, however, so the latest session did not produce a fresh trend signal of that kind. The shares gained 0.20% over five days and 5.63% over one month. They are also at 100% of the reported 20-session range, with resistance at $348.91, and are nearing the three-month peak of $351.73. That positioning makes the next move more consequential: a sustained push through the recent high would extend the advance, while rejection near that area could leave the stock vulnerable to a pullback toward support. The Bollinger Bands reinforce the near-resistance reading. The bands have narrowed to a 5.5% width, a squeeze that indicates recent price movement has become more contained and can precede a larger move, though it does not specify the direction. With the price at 89% of the way between the lower and upper bands, it is closer to the upper boundary than the lower one. The $350.98 upper band and $351.73 three-month high form the immediate overhead test. As shown in the chart, the price is pressing the upper end of its range while the moving averages and band boundaries provide nearby reference levels.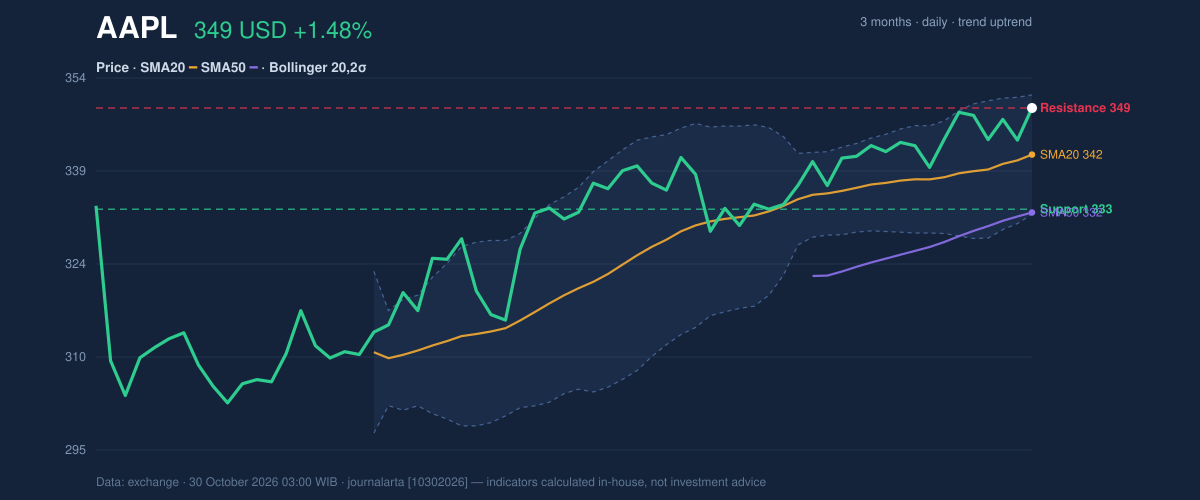
Oscillators & Momentum
Momentum has improved, but the indicators describe different speeds of the move. The MACD is 3.966 against a signal line of 3.924, leaving a positive histogram of 0.041. The histogram has just turned positive, the selection signal drawing attention to Apple; it suggests the MACD line is edging ahead of its signal line, a modest sign that upward momentum is strengthening. MACD momentum is positive, but the margin is narrow. The RSI, at 60.7, remains neutral rather than signaling an extreme condition. By contrast, Stochastic %K at 80.0 and %D at 73.5 are in overbought territory. Stochastic compares a recent closing price with its recent trading range and can show when prices are clustering near the top of that range; it may stay elevated during a strong advance, so it is a caution signal, not proof that a reversal has begun. RSI is neutral while Stochastic is overbought, a split that points to a rising trend with short-term extension risk. The chart helps distinguish those signals: MACD is positive, while Stochastic is already near the upper end of its scale.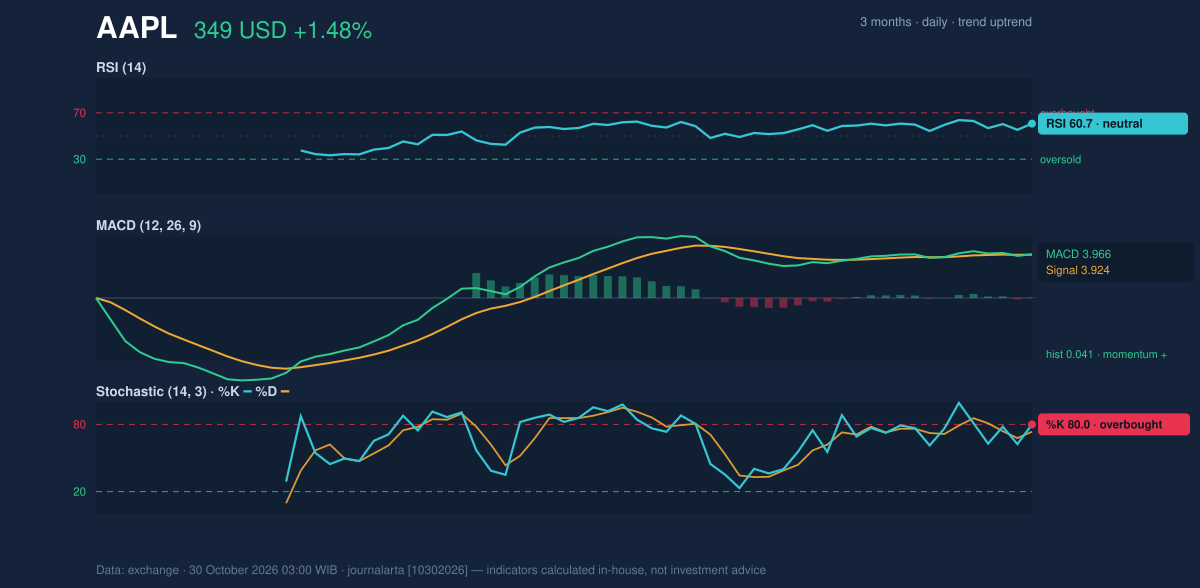
Volatility, Volume & Key Levels
The average true range, or ATR, is $6.06, equal to 1.7% of the share price. ATR estimates typical price movement rather than forecasting direction; this reading indicates moderate volatility. Volume reached 42,382,900 shares, about 1.1 times the 20-session average of 38,672,585. On-balance volume (OBV), which tracks whether volume is flowing more with rising or falling prices, is also rising. That combination gives the advance some participation confirmation rather than leaving it supported by price alone. The key near-term test is whether Apple can hold above its 20-day average at $341.54 and build on the approach to the upper band and three-month high. A break above $351.73 would clear the stated three-month peak; failure to sustain the move could bring the $332.89 20-session support into focus. That support sits near the $332.10 lower Bollinger Band and the $332.37 50-day average, creating a cluster of reference levels rather than a single isolated floor.Technical Verdict: HOLD (wait & see)
HOLD (wait & see) best fits the mixed setup. The upward trend is supported by price above both moving averages and a rising 20-day average; MACD has turned positive, with rising OBV and above-average volume lending participation. But the shares are at the top of the reported 20-session range, close to the three-month high, while Stochastic is overbought and the Bollinger squeeze leaves the direction of any expansion unresolved. - Ideal entry range: $341.54–$348.91, between the 20-day average and the current resistance level. - Exit target: $351.73, the reported three-month high. - Stop-loss protection: $332.10–$332.89, using the lower Bollinger Band and 20-session support as reference levels. - Invalidation condition: The verdict is invalidated if price falls below $332.10. For non-traders, the chart leans upward, but the stock is close to a recent ceiling and its next move has not yet been confirmed.| Indicator | Reading |
|---|---|
| Latest price | $348.91 |
| Change | 1 day: 1.48% | 5 days: 0.20% | 1 month: 5.63% |
| 20-day / 50-day average | $341.54 / $332.37 |
| RSI / Stochastic | 60.7 / 80.0 (%K), 73.5 (%D) |
| MACD / histogram | 3.966 / 0.041 |
| Upper / lower Bollinger Band | $350.98 / $332.10 |
| 20-session support / resistance | $332.89 / $348.91 |
| Three-month high / low | $351.73 / $300.00 |
| ATR / volume | $6.06 / 42,382,900 |
Summary Data AAPL
| Last price | 348.91 USD |
| Change 1 day / 5 days / 1 month | 1.48% / 0.20% / 5.63% |
| Trend / MA-cross | uptrend / none |
| SMA20 / SMA50 | 341.54 / 332.37 |
| RSI (14) / Stochastic %K | 60.7 / 80.0 |
| Bollinger %B / ATR | 89% / 6.06 |
| Support / Resistance 20 days | 332.89 / 348.91 |
| Data as of | 30 October 2026 03:00 WIB |
Disclaimer: This technical analysis is generated automatically from exchange data and indicators calculated by JournalArta, for information and education only. The verdict and the entry, target and stop-loss levels are not investment advice or a solicitation to buy or sell any security. Investment decisions and their risks rest solely with the reader.
Track AAPL stock price daily: live levels, support/resistance and our full AAPL analysis history.