IBM RSI Overbought: Stock Gains 2.00% (October 29, 2026)
On October 29, 2026: price 258.28 USD, trend uptrend, RSI 72.3, support 220.51, resistance 258.28. technical analysis of ibm stock. IBM RSI Overbought — full…
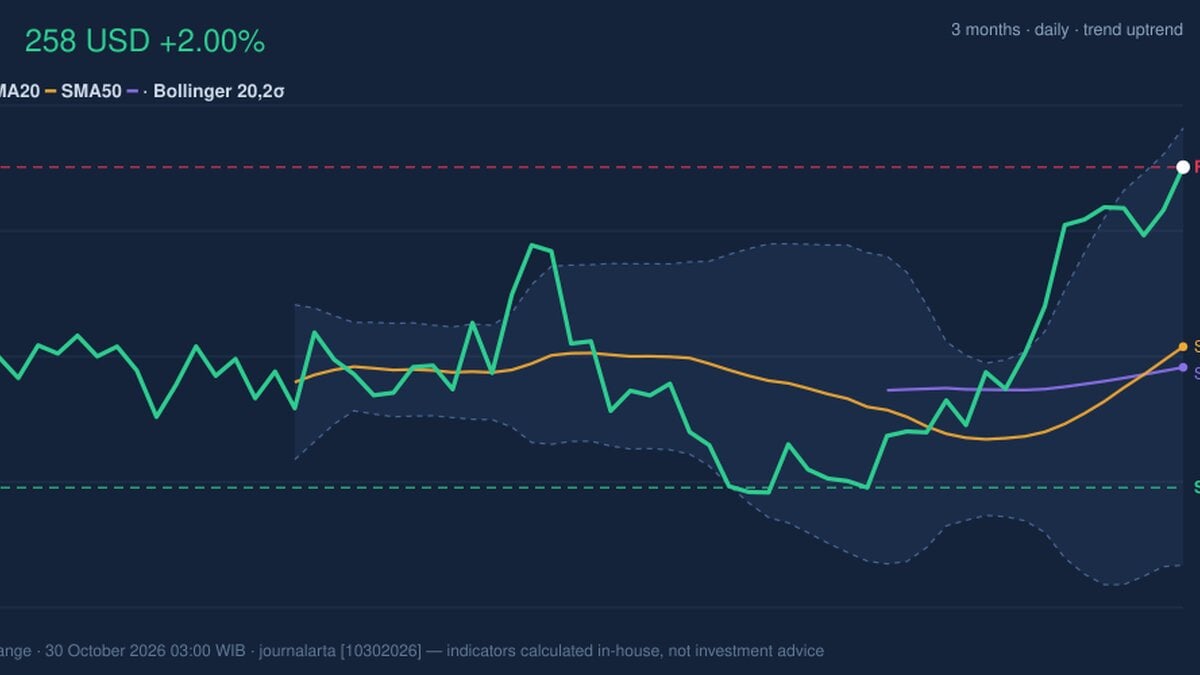
Why IBM is in focus today
- Closed at a 20-day high (258.28)
- Trading near its 3-month high (258.33)
- Fresh golden cross: SMA20 crossed above SMA50
- RSI(14) at 72.3 — overbought zone
- Uptrend confirmed (5-day change 2.45%)
Selected automatically from 30 NYSE (US) stocks by a technical-signal score with daily weighted randomisation — not a recommendation.
Trend & Price Action
IBM gained 2.00% in one day, 2.45% over five days and 14.48% over one month, according to the market data provided. The close was above both the 20-day simple moving average, at $237.12, and the 50-day average, at $234.68. A simple moving average tracks the mean closing price over a set period, helping show whether the prevailing direction is strengthening or weakening. The 20-day average rose 3.42% over five days, a sign that the shorter-term trend has been gaining pace. The golden cross, formed one session before the latest session, adds to that evidence: it occurs when the 20-day average crosses above the 50-day average, a pattern often associated with a shift toward an upward trend. But the close is also at the top of its 20-day range and near the three-month high of $258.33, leaving little room before the next test of resistance. As shown in the chart, price has moved well above its moving averages and is approaching the upper Bollinger Band. Bollinger Bands measure how far prices are moving around an average; their widening here points to increased volatility, not a guarantee that the rally will continue.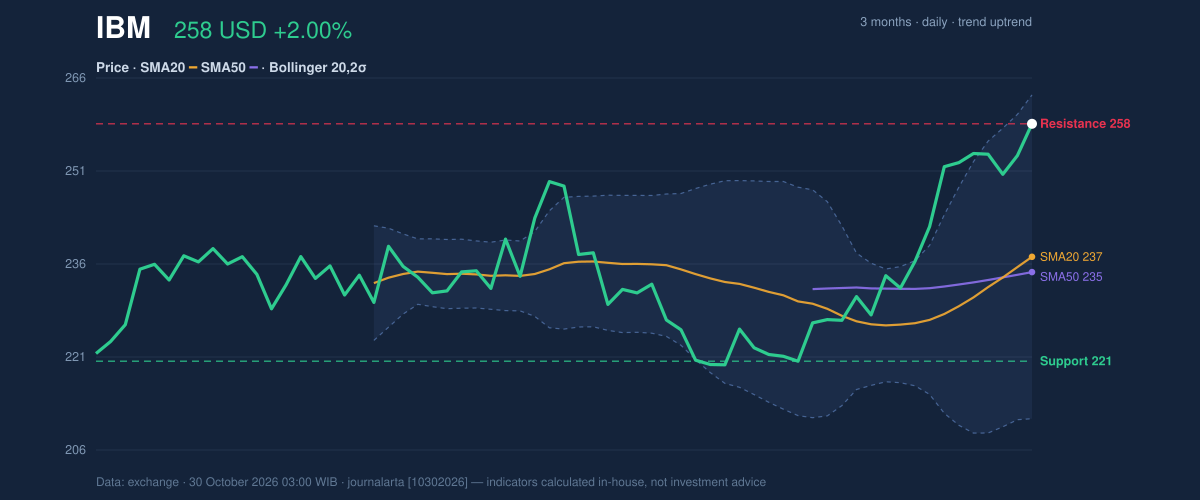
Oscillators & Momentum
Momentum indicators confirm the uptrend but also warn that the move has become crowded. The RSI is 72.3, in overbought territory. The Relative Strength Index compares recent gains with losses; readings above 70 are commonly treated as a sign that prices have risen quickly, though they do not by themselves predict a reversal. The Stochastic readings are also overbought, with %K at 99.9 and %D at 91.5. This indicator compares a recent close with the price range over a chosen period, so values near the top suggest IBM is closing near the upper end of that range. Meanwhile, the MACD remains positive: its 6.895 reading is above the 4.366 signal line, with a positive 2.530 histogram. That supports the direction of the trend, even as the other oscillators flag a possible pause or pullback.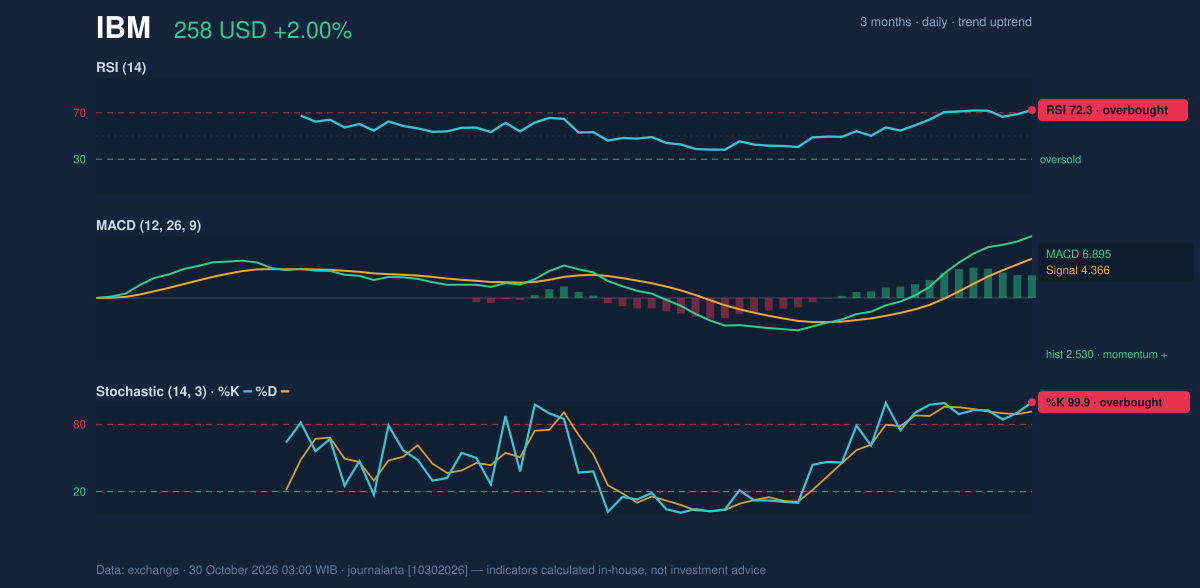
Volatility, Volume & Key Levels
The Bollinger %B reading of 91% places IBM close to the upper band, at $262.88, while the band width of 21.7% is widening. In plain terms, price is near the top of a broadening recent range, where larger swings are becoming more likely. The 14-day Average True Range, a measure of typical daily price movement, is $7.75, or 3.0% of the share price—consistent with moderate volatility. Participation was less emphatic than the price rise. Volume was 3,922,200 shares, or 0.7 times the 20-day average of 5,592,470. That comparatively light turnover means the advance drew less trading activity than usual. On the other hand, rising On-Balance Volume, which tracks whether volume is more associated with up or down sessions, provides a measure of underlying support. The immediate reference is the $258.28 resistance, also the 20-day range high and the close on Thursday. The three-month high of $258.33 is only slightly above it. A sustained move beyond that area would show buyers overcoming the nearby ceiling; failure to hold the breakout area would leave the moving averages and the broader support range as reference points. The 20-day support is $220.51, although the 20-day average at $237.12 is a nearer trend gauge. The three-month low is $216.59.Technical Verdict: HOLD (wait & see)
HOLD (wait & see) reflects a strong trend facing an immediate test. The golden cross and rising 20-day average support the bullish structure; positive MACD confirms upward momentum; but RSI and Stochastic are overbought, while price is pressing against resistance on below-average volume. The verdict is invalidated if price falls below $220.51, the 20-day support level.- Ideal Entry Range: $237.12–$258.28, bounded by the 20-day average and the current resistance area.
- Exit Target: $262.88, the upper Bollinger Band.
- Stop Loss: $220.51, the 20-day support level.
Data Table
| Indicator | Reading |
|---|---|
| Last price | $258.28 |
| Change | 1 day: 2.00% | 5 days: 2.45% | 1 month: 14.48% |
| SMA20 / SMA50 | $237.12 / $234.68 |
| Golden cross | Formed one session before the latest session |
| Bollinger Bands | Upper $262.88 | Middle $237.12 | Lower $211.35 | %B 91% | Width 21.7% |
| RSI / Stochastic | 72.3 | %K 99.9 / %D 91.5 |
| MACD | 6.895 | Signal 4.366 | Histogram 2.530 |
| ATR(14) | $7.75 (3.0%) |
| Volume / OBV | 3,922,200 | 0.7× 20-day average | OBV rising |
| 20-day support / resistance | $220.51 / $258.28 |
| Three-month high / low | $258.33 / $216.59 |
Summary Data IBM
| Last price | 258.28 USD |
| Change 1 day / 5 days / 1 month | 2.00% / 2.45% / 14.48% |
| Trend / MA-cross | uptrend / golden |
| SMA20 / SMA50 | 237.12 / 234.68 |
| RSI (14) / Stochastic %K | 72.3 / 99.9 |
| Bollinger %B / ATR | 91% / 7.75 |
| Support / Resistance 20 days | 220.51 / 258.28 |
| Data as of | 30 October 2026 03:00 WIB |
Disclaimer: This technical analysis is generated automatically from exchange data and indicators calculated by JournalArta, for information and education only. The verdict and the entry, target and stop-loss levels are not investment advice or a solicitation to buy or sell any security. Investment decisions and their risks rest solely with the reader.
Track IBM stock price daily: live levels, support/resistance and our full IBM analysis history.