CAT Stock Drops 9.25% on Thursday, RSI Oversold
On October 29, 2026: price 647.39 USD, trend downtrend, RSI 26.4, support 647.39, resistance 863.44. technical analysis of cat stock. CAT Stock Drops — full…
Why CAT is in focus today
- One-day move of -9.25%, about 1.9× its average daily range (ATR)
- Volume at 2.7× the 20-day average
- Closed at a 20-day low (647.39)
- RSI(14) at 26.4 — oversold zone
- Downtrend extending (5-day change -8.05%)
Selected automatically from 30 NYSE (US) stocks by a technical-signal score with daily weighted randomisation — not a recommendation.
Trend & Price Action
At $647.39, Caterpillar trades below its 20-day average of $755.18 and its 50-day average of $787.16. The averages have not formed a new crossover, so there is no fresh technical signal from one average moving across the other. The broader message is still clear: price is weak, and the short-term average is declining. The close sits at the bottom of the 20-session range. The stock’s three-month low is $631.01, leaving that level as a nearby reference point, while the 20-session support is listed at $647.39. A support level is an area where buyers have previously appeared; it is not a guarantee against further falls. The 20-day average is falling, and the price remains well below both trend measures.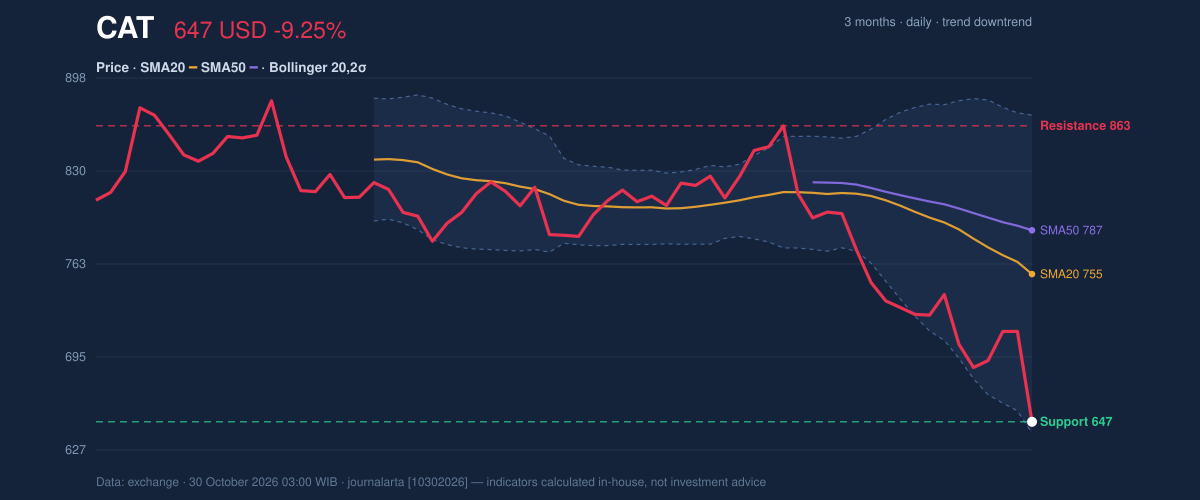
Oscillators & Momentum
The relative strength index (RSI), a measure of the speed and scale of recent price moves, is 26.4, within the oversold zone. The Stochastic readings are also oversold, with %K at 9.1 and %D at 19.5. These signals indicate that the decline has been sharp; they do not confirm a reversal. The MACD, another trend-and-momentum measure, is negative at -33.505, below its -25.851 signal line, with a negative histogram of -7.654. That alignment points to continuing downside momentum rather than a confirmed turn. In other words, short-term selling pressure is intense, but the indicators that track trend have not yet aligned with a recovery. RSI and Stochastic are oversold, while MACD remains negative.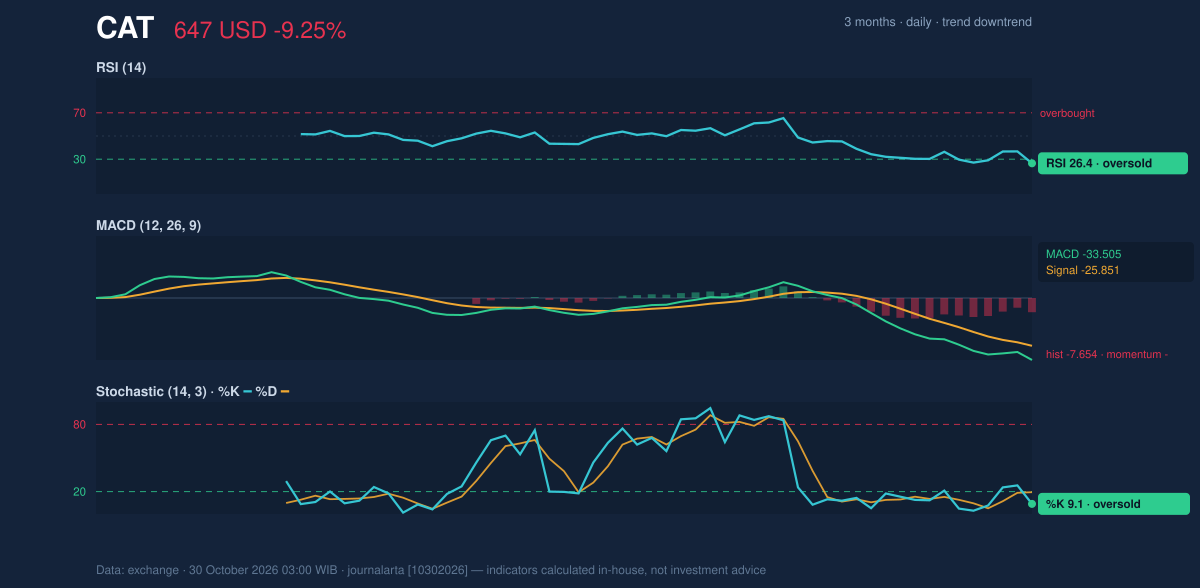
Volatility & Volume
The Bollinger Bands, which track price relative to a moving average and its recent volatility, are widening. Their lower boundary is $639.16, the middle line is $755.18 and the upper boundary is $871.19. Caterpillar’s position at %B of 4% places it close to the lower band. The widening bands suggest larger price swings, not a reliable indication of which direction the next move will take. Average true range (ATR), a measure of typical trading movement, stands at $30.93, or 4.8% of the share price. The session’s 9.25% fall was therefore substantially larger than the recent typical range. Volume was 8,154,500 shares against a 20-session average of 3,035,725. The on-balance volume measure, which tracks whether volume generally accompanies rising or falling prices, is also declining. Together, elevated turnover and falling OBV indicate that selling was broadly supported by trading activity, rather than occurring on unusually light volume. Widening bands and heavy volume point to heightened uncertainty, not a confirmed bottom.Key Levels & Scenarios
The lower Bollinger Band at $639.16 and the three-month low at $631.01 are the nearest lower reference levels in the supplied data. If price holds above those areas, oversold readings could accompany a stabilization attempt; if it falls below them, the technical case for continued weakness strengthens. On the upside, the 20-day average at $755.18 is an initial trend reference, while the listed 20-session resistance is $863.44. A move toward those levels would still need to contend with the declining averages and negative MACD. Support is clustered near $639.16 and $631.01; resistance is listed at $863.44.Technical Verdict: HOLD (wait & see)
The technical picture is mixed but leans toward caution: the price is in a pronounced downtrend below both moving averages; MACD and OBV confirm persistent selling pressure; and RSI and Stochastic are oversold, raising the possibility of a short-term pause without establishing a reversal. The verdict is invalidated if the price falls below the three-month low of $631.01. - Ideal entry range: $639.16–$647.39, based on the lower Bollinger Band and the listed 20-session support. - Exit target: $755.18, the 20-day average and Bollinger middle line. - Stop-loss protection: $631.01, the three-month low. For non-traders, the indicators show a steep decline with possible short-term exhaustion, but no reliable confirmation yet that the trend has turned. *Technical analysis only; not an investment recommendation.*| Indicator | Reading |
|---|---|
| Last price | $647.39 |
| Change | 1 day -9.25% | 5 days -8.05% | 1 month -21.66% |
| SMA20 / SMA50 | $755.18 / $787.16 |
| RSI(14) | 26.4 — oversold |
| Stochastic %K / %D | 9.1 / 19.5 — oversold |
| MACD / signal / histogram | -33.505 / -25.851 / -7.654 |
| Bollinger lower / middle / upper | $639.16 / $755.18 / $871.19 |
| ATR(14) | $30.93 (4.8%) |
| Volume / 20-session average | 8,154,500 / 3,035,725 |
| 20-session support / resistance | $647.39 / $863.44 |
| Three-month high / low | $935.00 / $631.01 |
Summary Data CAT
| Last price | 647.39 USD |
| Change 1 day / 5 days / 1 month | -9.25% / -8.05% / -21.66% |
| Trend / MA-cross | downtrend / none |
| SMA20 / SMA50 | 755.18 / 787.16 |
| RSI (14) / Stochastic %K | 26.4 / 9.1 |
| Bollinger %B / ATR | 4% / 30.93 |
| Support / Resistance 20 days | 647.39 / 863.44 |
| Data as of | 30 October 2026 03:00 WIB |
Disclaimer: This technical analysis is generated automatically from exchange data and indicators calculated by JournalArta, for information and education only. The verdict and the entry, target and stop-loss levels are not investment advice or a solicitation to buy or sell any security. Investment decisions and their risks rest solely with the reader.
Track CAT stock price daily: live levels, support/resistance and our full CAT analysis history.