LLY Stock Technicals: Gains 6.63% on Thursday, RSI Overbought
On October 29, 2026: price 1,373.70 USD, trend uptrend, RSI 74.5, support 1,142.85, resistance 1,373.70. technical analysis of lly stock.
By Alistair Sterling
October 30, 20264 min read
LLY Stock Technicals
Why LLY is in focus today
One-day move of 6.63%, about 2.1× its average daily range (ATR)
Volume at 1.8× the 20-day average
Closed at a 20-day high (1,373.70)
RSI(14) at 74.5 — overbought zone
Uptrend confirmed (5-day change 5.13%)
Selected automatically from 30 NYSE (US) stocks by a technical-signal score with daily weighted randomisation — not a recommendation.
Eli Lilly rose 6.63% to $1,373.70 in Thursday’s session, October 29, with trading volume 1.8 times its 20-session average. The move was unusually large relative to the stock’s recent trading range and took the shares to their 20-session high. That is a strong burst of buying interest, but the price also closed above its upper Bollinger Band as momentum indicators entered overbought territory—a combination that raises the risk of a pause or pullback even while the broader trend remains upward.
Trend & Price Action
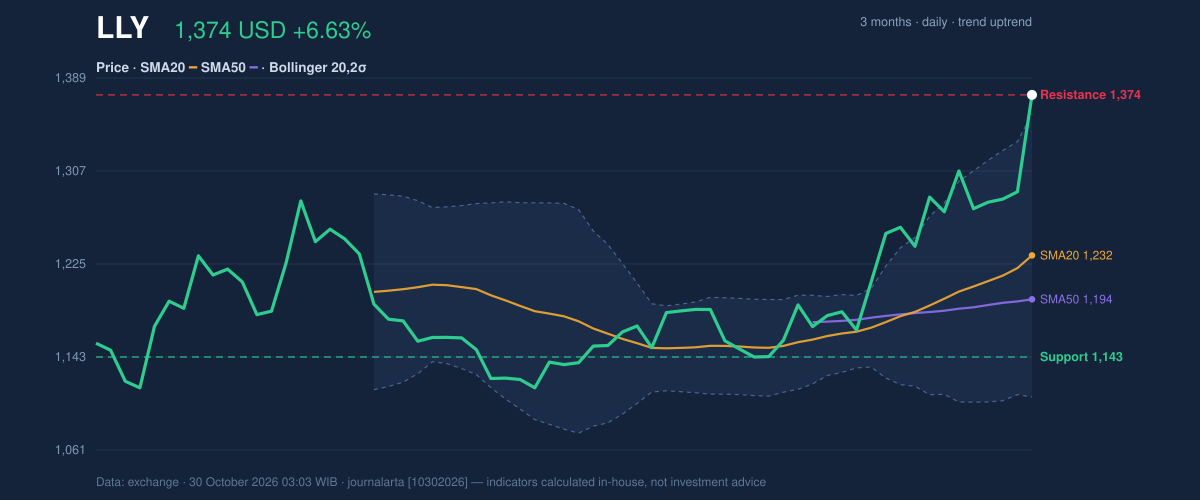
The share price is well above its 20-day average of $1,232.28 and its 50-day average of $1,193.68. The 20-day average itself rose 2.65% over five days, indicating that the underlying trend is strengthening rather than merely reflecting a single session’s jump. There is no new moving-average crossover, so the trend signal comes from the price’s position above both averages and the rising short-term average—not from a newly formed “golden cross,” a bullish crossover between shorter- and longer-term averages.
The session’s gain exceeded the 3.2% average true range, a measure of typical daily movement, and volume reached 1.8 times its 20-session average. That suggests the move drew broader participation than a thinly traded fluctuation. On-balance volume, which tracks whether trading volume accompanies rising or falling prices, also rose, adding confirmation. Still, the shares ended at the top of their 20-session range and near the three-month high of $1,408.38, leaving limited room before a significant reference point.
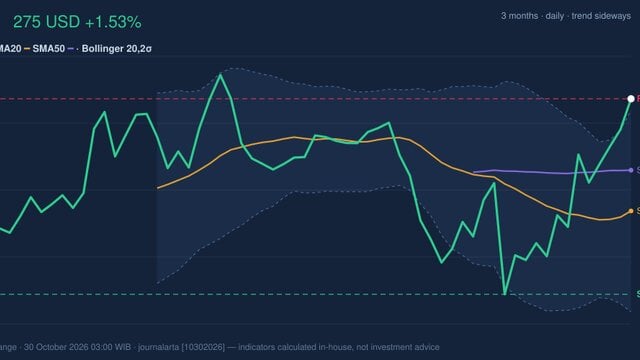
The price is above both moving averages, but its close beyond the upper band makes the rally look stretched in the near term. As shown in the chart, the upper Bollinger Band is $1,356.95, below the latest price; a reading above the band signals unusually strong movement, not a guarantee that gains will continue.
3-month price action chart of LLY: price, SMA20/50, Bollinger, support & resistance.
Oscillators & Momentum
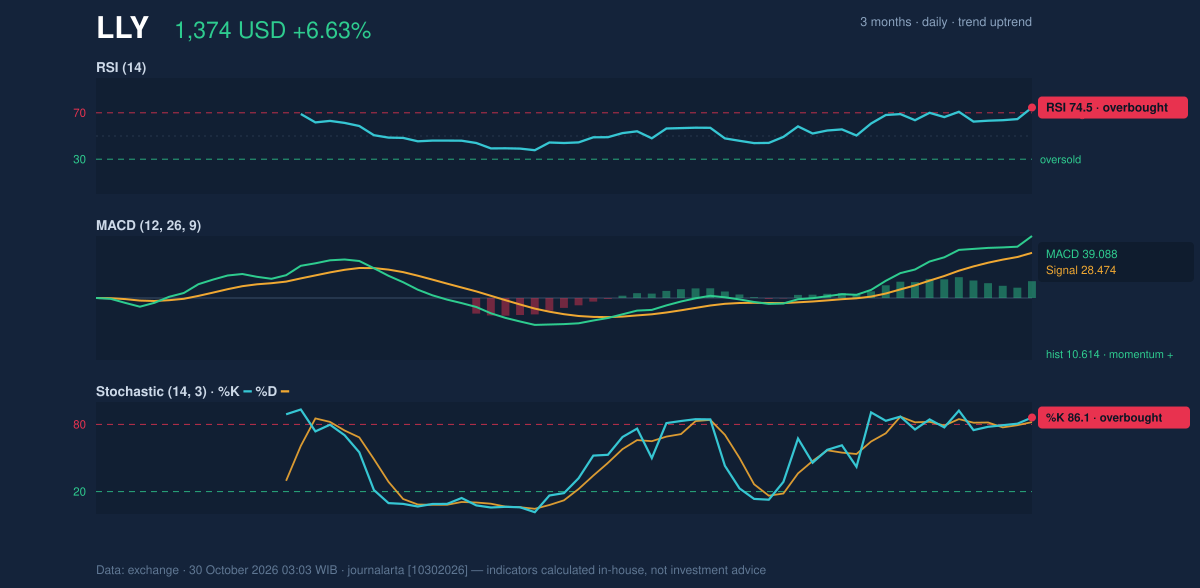
Momentum confirms the strength of the advance, while also flashing a caution. The RSI, a measure of the speed and scale of recent price changes, is 74.5, in overbought territory. The Stochastic oscillator, which compares the latest close with the recent trading range, is also elevated: %K is 86.1 and %D is 82.0, both overbought. These readings do not predict an immediate reversal. They do mean that a growing share of recent buying has already been reflected in price, making the stock more vulnerable to profit-taking.
The MACD remains supportive: the MACD at 39.088 is above its 28.474 signal line, with a positive 10.614 histogram. In plain terms, upward momentum is still ahead of its comparison line. That contrast—positive MACD but overbought RSI and Stochastic—describes a strong trend that may need to consolidate before it can extend comfortably.
Momentum chart of LLY: RSI(14), MACD, Stochastic.
Volatility & Key Levels
Bollinger Band width is 20.2% and widening, a sign that price swings are expanding. The 14-session ATR of $43.95, or 3.2% of the share price, points to moderate volatility by the supplied measure, but the latest gain shows that individual sessions can be much more forceful. With the price at 107% of the band range and above the upper band, the market is moving in an unusually extended fashion.
The nearest major reference on the upside is the three-month high at $1,408.38. A sustained move beyond that level would put the current breakout to a new test, while failure to hold the session’s high of $1,373.70 could signal that buyers are losing control after the surge. The longer-term support reference is $1,142.85, the 20-session support level; the 20-day average at $1,232.28 is a nearer trend gauge, though not a confirmed support level.
Technical Verdict: HOLD (wait & see)
The indicators support a rising trend, but the combination of an overbought RSI and Stochastic, a close above the upper Bollinger Band, and a price at the top of its 20-session range argues for caution rather than assuming the advance can continue without a pause. Rising volume, OBV and positive MACD are the strongest counterweights.
- Illustrative entry range: $1,232.28–$1,356.95, bounded by the 20-day average and upper Bollinger Band.
- Illustrative exit target: $1,408.38, the three-month high.
- Illustrative stop-loss protection: $1,142.85, the 20-session support level.
- Invalidation: This HOLD assessment is invalidated if price falls below $1,142.85.
For non-traders, the trend is positive, but the shares have risen far enough that a pullback would not, by itself, disprove the underlying strength. These technical levels describe the current chart setup, not an investment recommendation.
Data
Eli Lilly (NYSE: LLY), Thursday, October 29, 2026. Last price: $1,373.70; one-day change: 6.63%; five-day change: 5.13%; one-month change: 19.47%. Data: supplied market dataset.
Summary Data LLY
Last price
1,373.70 USD
Change 1 day / 5 days / 1 month
6.63% / 5.13% / 19.47%
Trend / MA-cross
uptrend / none
SMA20 / SMA50
1,232.28 / 1,193.68
RSI (14) / Stochastic %K
74.5 / 86.1
Bollinger %B / ATR
107% / 43.95
Support / Resistance 20 days
1,142.85 / 1,373.70
Data as of
30 October 2026 03:03 WIB
Disclaimer: This technical analysis is generated automatically from exchange data and indicators calculated by JournalArta, for information and education only. The verdict and the entry, target and stop-loss levels are not investment advice or a solicitation to buy or sell any security. Investment decisions and their risks rest solely with the reader.