Testing Key Resistance, Visa Stock Gains 2.48% on Thursday
On October 29, 2026: price 410.54 USD, trend uptrend, RSI 67.6, support 360.66, resistance 414.34. technical analysis of visa stock. Testing Key Resistance —…
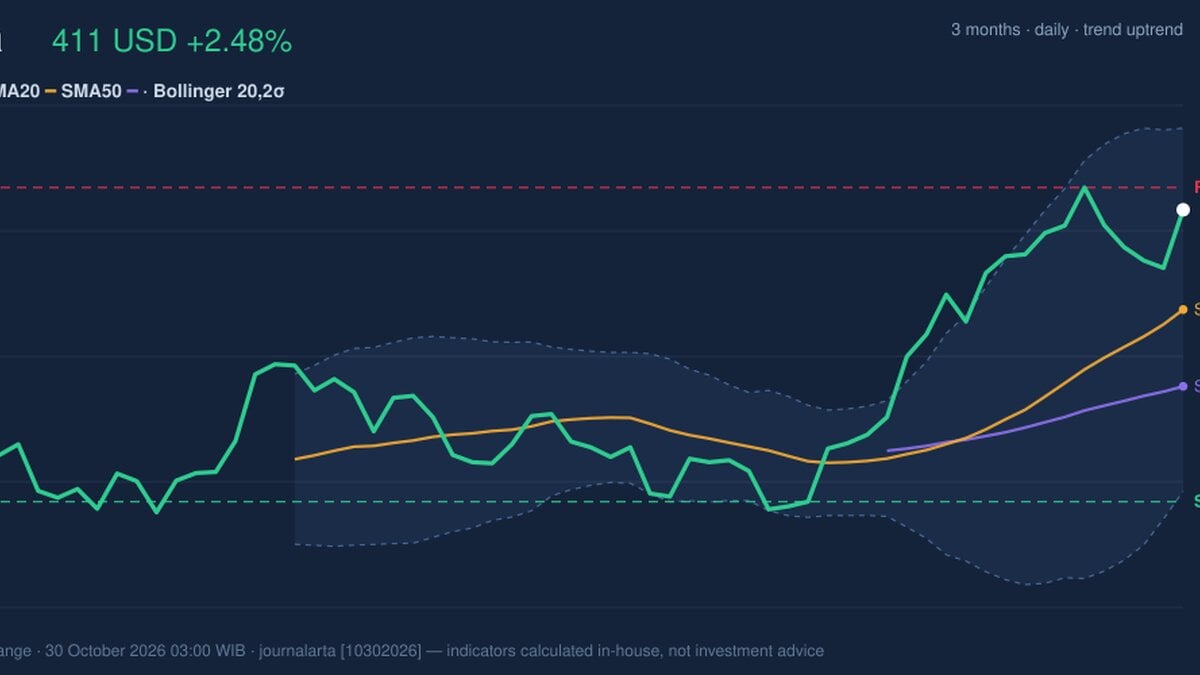
Why Visa is in focus today
- One-day move of 2.48%, about 1.4× its average daily range (ATR)
- Trading near its 3-month high (414.60)
Selected automatically from 30 NYSE (US) stocks by a technical-signal score with daily weighted randomisation — not a recommendation.
Trend & Price Action
Visa remains in an uptrend: its share price is above both the 20-day simple moving average (SMA) of $393.48 and the 50-day average of $380.35. The 20-day average rose 2.67% over five days, indicating that the short-term trend itself is strengthening. There was no new moving-average crossover, so the case rests on the existing upward structure rather than a fresh technical trigger. The daily gain came after a 0.92% decline over five days, while the one-month change was 14.09%. That contrast suggests a strong broader advance interrupted by a small recent pullback, rather than a steady climb in every session. At $410.54, Visa is also 93% of the way through its 20-session trading range, between support at $360.66 and resistance at $414.34. The price is testing resistance near $414, with the three-month high of $414.60 adding another nearby hurdle. As shown in the chart, the relationship between price and its moving averages remains constructive, but the distance to resistance is now much smaller than the gap to support.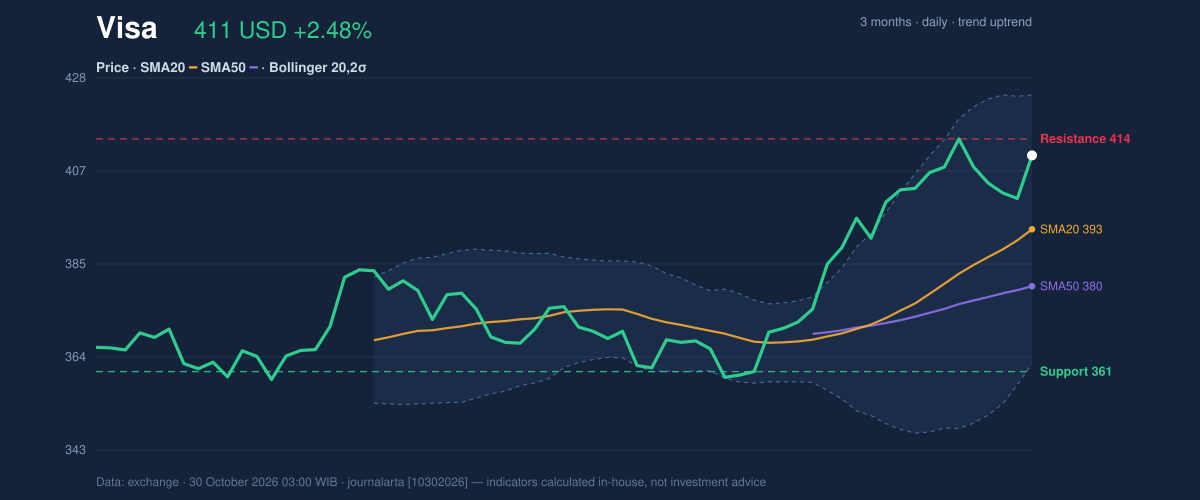
Oscillators & Momentum
Momentum indicators are positive, though they do not all point to the same degree of near-term heat. The RSI, a measure of the speed and scale of recent price moves, stands at 67.6, in neutral territory. That reading is elevated but has not crossed the data’s overbought threshold. The Stochastic oscillator is more stretched: %K is 86.4 and %D is 73.9, an overbought signal. This can occur when prices close consistently near the top of their recent range. It does not by itself establish that a reversal is under way, but it raises the risk that further gains could be interrupted by a pause or pullback. The MACD line is at 9.299, above its 8.837 signal line, with a positive 0.462 histogram. That positive MACD configuration confirms upward momentum, while the Stochastic reading warns that the advance may be running hot in the short term. The distinction matters: the indicators support the trend, but they differ on how much room may remain before momentum cools.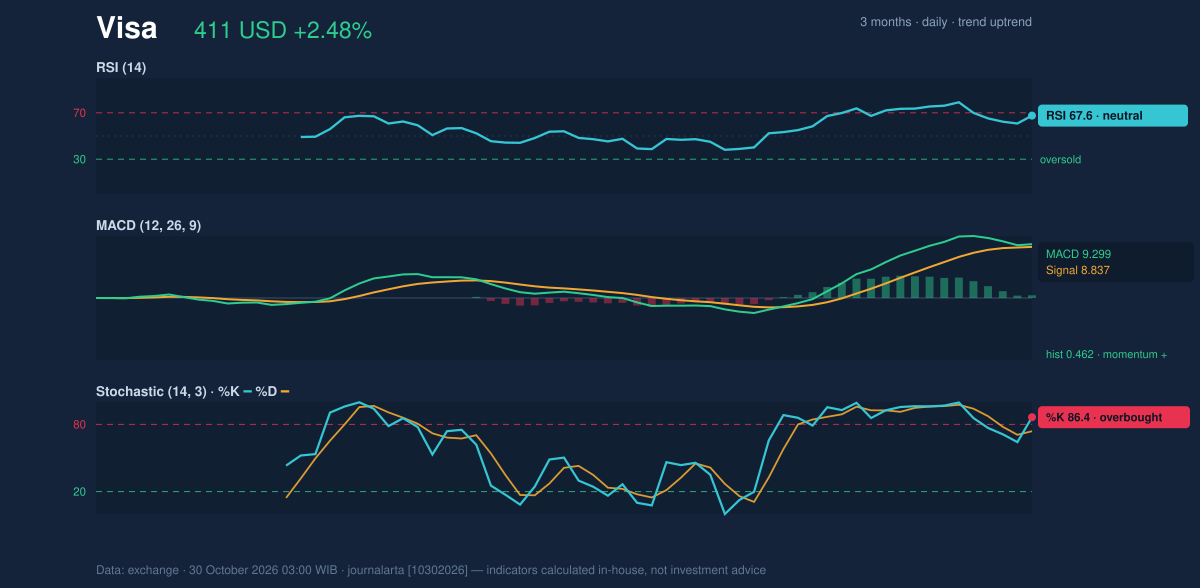
Volatility & Volume
Visa’s Bollinger Bands are at normal width, with a 15.8% band spread and the share price at 78% of the distance from the lower to the upper band. The bands have not narrowed into a squeeze, nor do the supplied readings indicate an unusually broad volatility expansion. The price is in the upper portion of the band, consistent with strength but also with its proximity to resistance. The 14-day average true range, which measures typical trading movement, is $7.48, or 1.8% of the share price—moderate volatility. Volume reached 7,693,000 shares against a 20-session average of 6,137,490, while on-balance volume was rising. Above-average volume and rising OBV support the view that the advance has participation behind it, rather than being a price move accompanied by fading trading activity.Key Levels & Scenarios
The nearest technical test is resistance at $414.34, close to the three-month high of $414.60. A sustained move above that area would put the recent ceiling under pressure; a failure to hold near resistance could instead leave Visa vulnerable to a retreat toward the 20-day average at $393.48. Below that, the 50-day average at $380.35 is another reference point before the 20-session support at $360.66. The upper Bollinger Band at $424.50 is a further reference if resistance gives way, not a guaranteed destination. Conversely, a fall below the 20-day average would weaken the short-term trend signal even if the broader structure remained above the 50-day average.Technical Verdict: HOLD (wait & see)
Core read: the trend and trading participation are positive, but overbought Stochastic readings and resistance near the three-month high argue for caution. - Ideal entry range: $393.48–$400.60, around the 20-day average and the previous close. - Exit target: $414.34–$424.50, spanning near-term resistance to the upper Bollinger Band. - Stop-loss protection: $380.35, the 50-day average. - Invalidation: The HOLD verdict is invalidated if price falls below $380.35. For non-traders, the chart still leans upward, but Visa is near a ceiling and short-term momentum is stretched.| Indicator | Reading |
|---|---|
| Last price | $410.54 |
| Daily / five-day / one-month change | +2.48% / -0.92% / +14.09% |
| SMA20 / SMA50 | $393.48 / $380.35 |
| RSI / Stochastic | 67.6 / %K 86.4, %D 73.9 |
| MACD / signal / histogram | 9.299 / 8.837 / 0.462 |
| Support / resistance (20 sessions) | $360.66 / $414.34 |
Summary Data Visa
| Last price | 410.54 USD |
| Change 1 day / 5 days / 1 month | 2.48% / -0.92% / 14.09% |
| Trend / MA-cross | uptrend / none |
| SMA20 / SMA50 | 393.48 / 380.35 |
| RSI (14) / Stochastic %K | 67.6 / 86.4 |
| Bollinger %B / ATR | 78% / 7.48 |
| Support / Resistance 20 days | 360.66 / 414.34 |
| Data as of | 30 October 2026 03:00 WIB |
Disclaimer: This technical analysis is generated automatically from exchange data and indicators calculated by JournalArta, for information and education only. The verdict and the entry, target and stop-loss levels are not investment advice or a solicitation to buy or sell any security. Investment decisions and their risks rest solely with the reader.
Track Visa stock price daily: live levels, support/resistance and our full Visa analysis history.