GOOGL Stock Drops 12.64%, RSI Oversold In Focus
On October 29, 2026: price 283.82 USD, trend downtrend, RSI 22.6, support 283.82, resistance 353.78. technical analysis of googl stock.
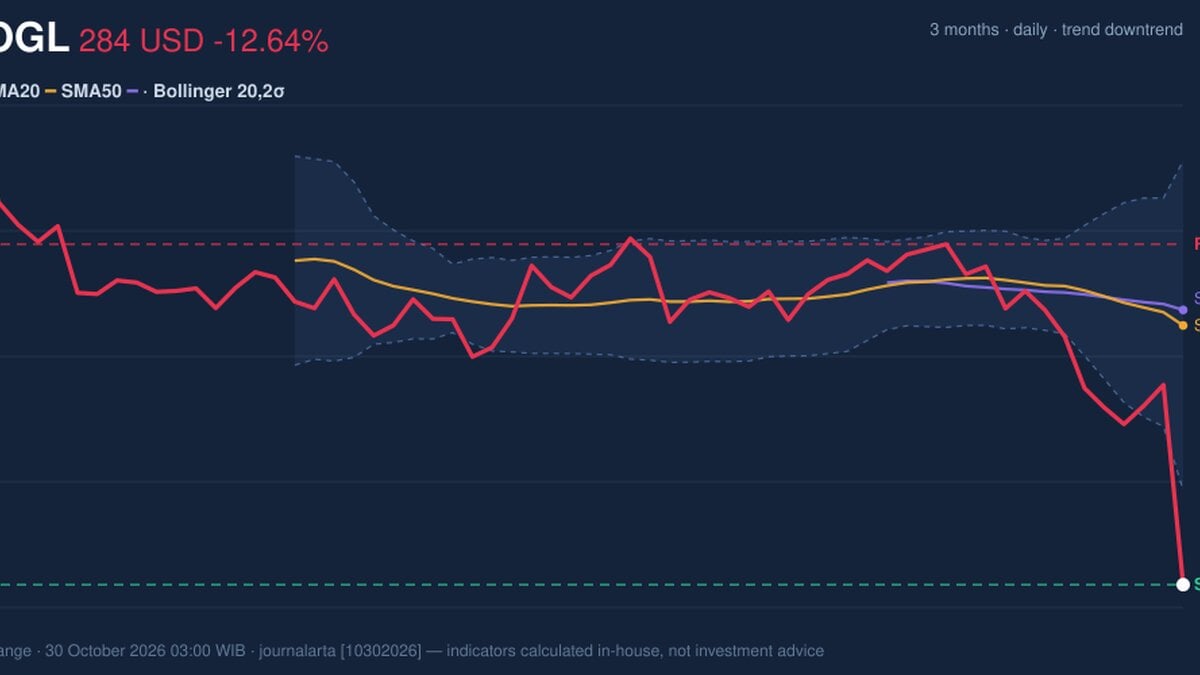
Alphabet’s 12.64% plunge puts the Google parent at a technical crossroads: Thursday’s close landed at its 20-session low after a heavy-volume sell-off, while momentum gauges reached oversold territory. For global investors, the tension is whether those readings signal an imminent pause or simply reflect the speed of a still-deepening decline.
Why GOOGL is in focus today
- One-day move of -12.64%, about 3.3× its average daily range (ATR)
- Volume at 4.5× the 20-day average
- Closed at a 20-day low (283.82)
- Trading near its 3-month low (280.36)
- Fresh death cross: SMA20 crossed below SMA50
- RSI(14) at 22.6 — oversold zone
- Downtrend extending (5-day change -12.46%)
Selected automatically from 32 NASDAQ (US) stocks by a technical-signal score with daily weighted randomisation — not a recommendation.
GOOGL ended Thursday, October 29, 2026, at $283.82, down 12.46% over five sessions and 16.09% over one month, according to the supplied market data. Volume surged to 138.9 million shares, 4.5 times its 20-session average, and on-balance volume (OBV)—a measure that tracks whether trading volume generally accompanies rising or falling prices—declined. That combination points to intense selling participation, rather than a drop on unusually quiet trading.
The scale of the move matters. The one-day decline was about 3.3 times the average daily trading range, while the average true range, a measure of typical price movement, stood at $10.78, or 3.8% of the share price. This was a sharp, high-volatility break, not a routine daily fluctuation.
Trend & Price Action
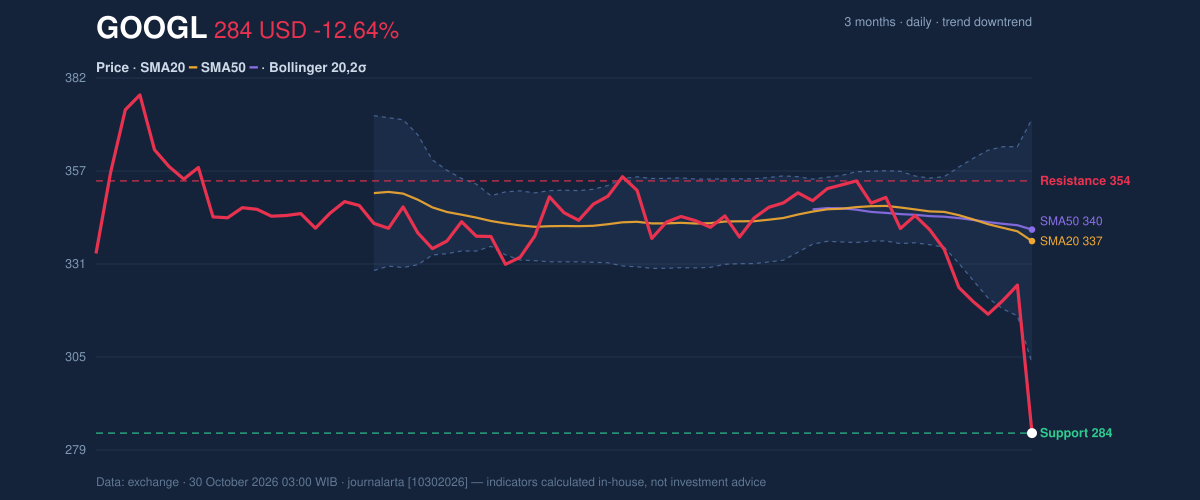
The share price finished below both its 20-day simple moving average (SMA), at $337.09, and its 50-day SMA, at $340.29. The 20-day average itself fell 2.09% over five days, showing that the short-term trend is weakening, not merely that price has slipped temporarily below a steady average. A death cross—the 20-day average moving below the 50-day average—formed three sessions before the latest session. It confirms the deterioration was already under way before Thursday’s sell-off.
Price is at the bottom of its 20-session range and close to the three-month low of $280.36. It is also below the lower Bollinger Band, a volatility-based boundary that stood at $303.21; the band’s negative %B reading of -29% reflects how far the price has moved beneath that range. The bands are widening, indicating volatility is expanding rather than settling.
The price structure remains decisively bearish, even with the stock near its three-month floor.
Oscillators & Momentum
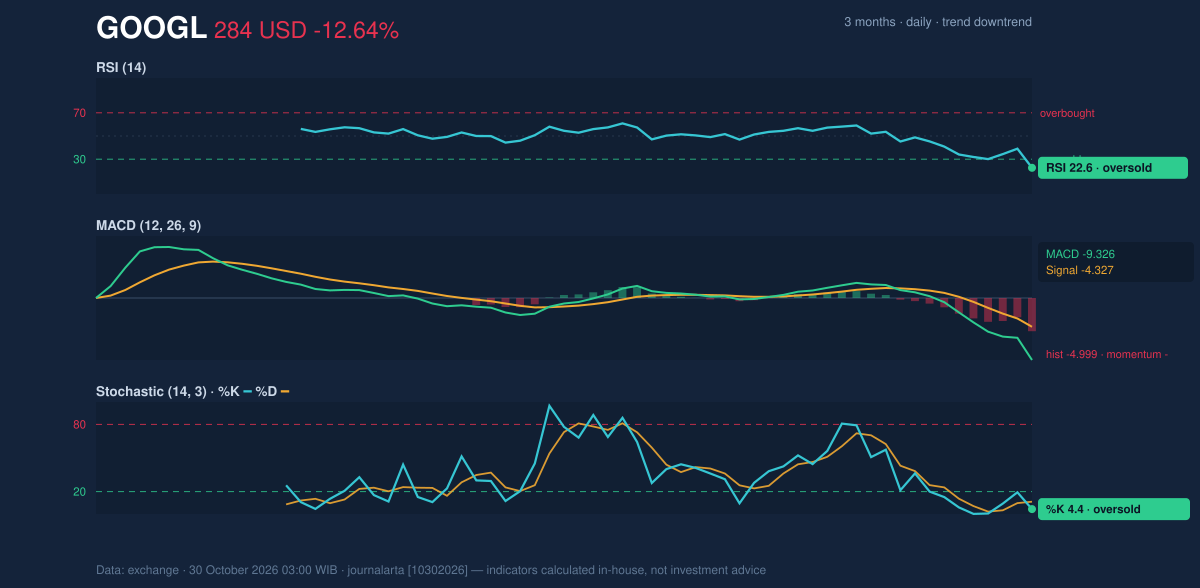
The relative strength index (RSI), which gauges the pace of recent gains and losses, was 22.6, in oversold territory. The Stochastic oscillator was also oversold, with %K at 4.4 and %D at 11.0. These readings mean the decline has been unusually forceful and may leave the shares vulnerable to a short-lived rebound. They do not, on their own, establish that selling has ended: oversold conditions can persist when a strong downtrend continues.
The moving average convergence divergence indicator (MACD), which compares shorter- and longer-term price momentum, offers no confirmation of a reversal. MACD was -9.326, below its -4.327 signal line, with a negative -4.999 histogram. In plain terms, downside momentum remains active even as RSI and Stochastic warn that the fall has become stretched.
Volatility, Volume & Key Levels
Thursday’s volume spike and falling OBV reinforce the bearish signal: trading activity rose sharply while the price fell, and the volume trend did not diverge in a way that would suggest buyers were quietly accumulating shares. Meanwhile, a 20.1% Bollinger Band width and elevated ATR show that daily swings may remain unusually large. Oversold readings therefore come with no reliable indication that volatility has peaked.
The immediate reference is $283.82, the 20-session support and Thursday close. Below it, the next stated chart reference is the three-month low of $280.36. On a rebound, $303.21, the lower Bollinger Band, is an initial technical hurdle; the 20-day average at $337.09 and 20-session resistance at $353.78 sit higher. A failure to hold the current support would leave the share price testing the three-month floor, while a recovery above $303.21 would be an early improvement—not yet a reversal of the trend.
The central conflict is clear: momentum is deeply oversold, but trend, volume and MACD still point down.
Technical Verdict: HOLD (wait & see)
The indicators support a neutral, wait-and-see reading rather than a directional signal. The reasons are the death cross and falling 20-day average, the negative MACD and declining OBV, offset by oversold RSI and Stochastic readings that raise the possibility of a relief bounce. This verdict is invalidated if price falls below $280.36, the three-month low.
- Ideal entry range: $280.36–$303.21, bounded by the three-month low and lower Bollinger Band.
- Exit target: $337.09, the 20-day average.
- Stop-loss protection: Below $280.36, the stated three-month low.
For non-traders, HOLD means the chart has not yet shown whether the steep decline is stabilizing or continuing.
Summary Data GOOGL
| Last price | 283.82 USD |
| Change 1 day / 5 days / 1 month | -12.64% / -12.46% / -16.09% |
| Trend / MA-cross | downtrend / death |
| SMA20 / SMA50 | 337.09 / 340.29 |
| RSI (14) / Stochastic %K | 22.6 / 4.4 |
| Bollinger %B / ATR | -29% / 10.78 |
| Support / Resistance 20 days | 283.82 / 353.78 |
| Data as of | 30 October 2026 03:00 WIB |
Disclaimer: This technical analysis is generated automatically from exchange data and indicators calculated by JournalArta, for information and education only. The verdict and the entry, target and stop-loss levels are not investment advice or a solicitation to buy or sell any security. Investment decisions and their risks rest solely with the reader.
Track GOOGL stock price daily: live levels, support/resistance and our full GOOGL analysis history.