AMZN Stock Drops 4.25% on Thursday, Golden Cross Formed
On October 29, 2026: price 243.79 USD, trend sideways, RSI 41.3, support 243.79, resistance 262.63. technical analysis of amzn stock. AMZN Stock Drops — full…
Why AMZN is in focus today
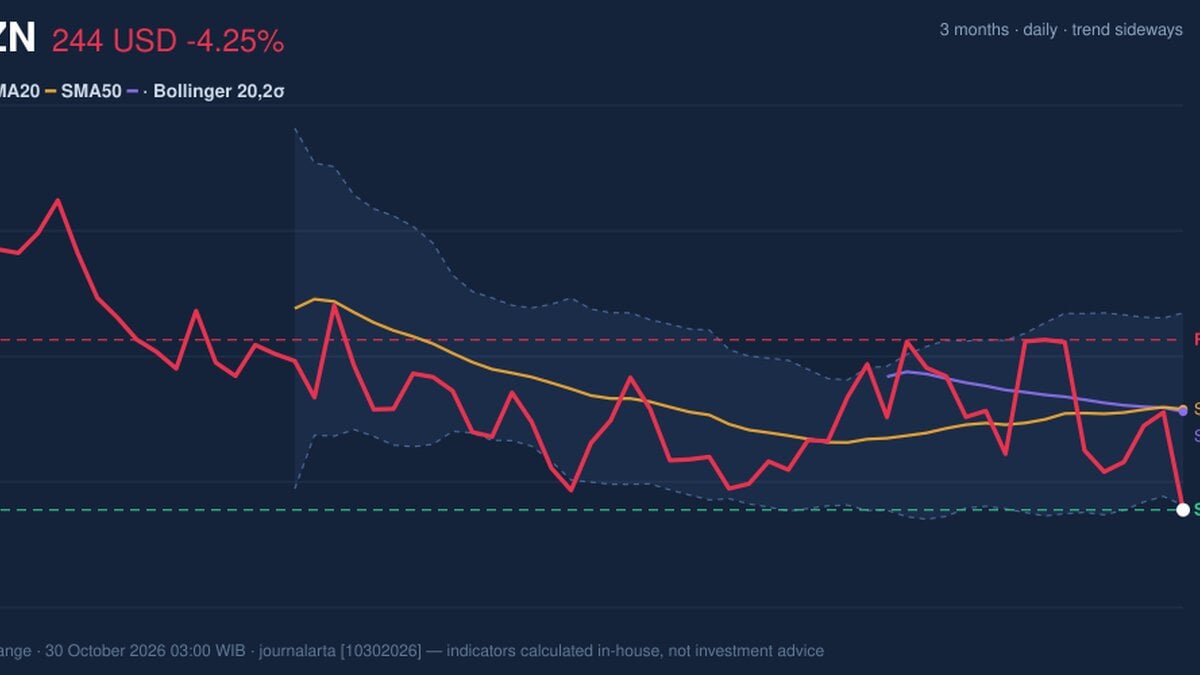
- One-day move of -4.25%, about 1.5× its average daily range (ATR)
- Volume at 2.2× the 20-day average
- Fresh golden cross: SMA20 crossed above SMA50
Selected automatically from 32 NASDAQ (US) stocks by a technical-signal score with daily weighted randomisation — not a recommendation.
Trend & Price Action
Amazon is in a sideways trend, and its 20-day average has risen just 0.17% over five days. That modest slope suggests the crossover reflects a narrow improvement in the averages, not a strong upward trend. The latest close of $243.79 sat below the 20-day average at $254.95 and the 50-day average at $254.67, leaving both as potential overhead barriers. The price also closed at the stated 20-session support and at 0% of the defined 20-session range. That puts the next test on whether buyers defend this level. The stock’s three-month range is $231.06 to $287.20, showing that the current price remains above the period low but well below its high. The golden cross is constructive, but the close below both averages makes it an unconfirmed signal. The chart places that tension alongside the support and resistance levels.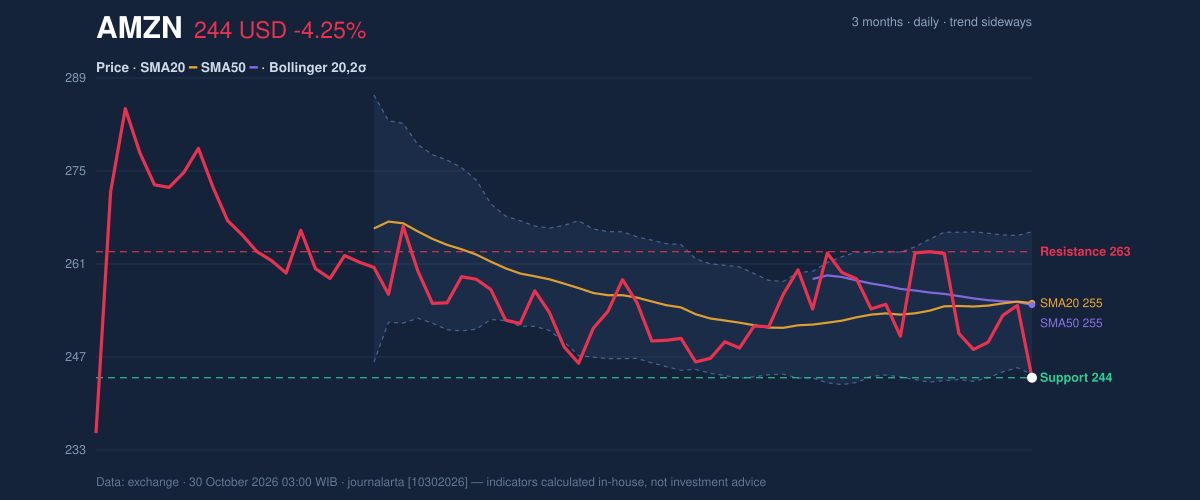
Oscillators & Momentum
Momentum indicators lean weak, though they do not all point to the same degree of stress. The RSI at 41.3 is neutral, meaning it signals neither a deeply oversold market nor strong upward momentum. By contrast, the Stochastic is oversold, with %K at 10.6 and %D at 29.6. That can indicate selling has been intense, but an oversold reading alone does not establish that a reversal has begun. The MACD reinforces the near-term weakness: MACD is negative at -1.082, below its -0.047 signal line, with a negative histogram of -1.035. This means the faster momentum measure is lagging the signal line, consistent with downward pressure. A move back above the signal line would help show that pressure is easing, but the supplied data do not yet show that shift.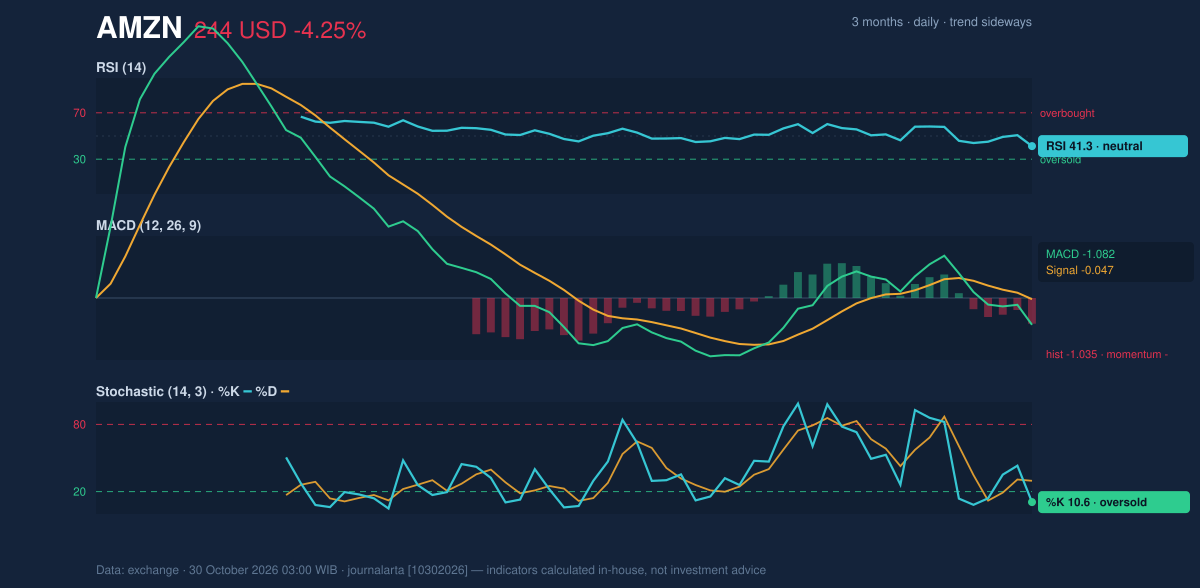
Volatility, Volume & Key Levels
Amazon closed below the lower Bollinger Band at $244.28, with %B at -2%. The bands’ 8.4% width is described as normal, so the move is not occurring within an unusually compressed volatility setup. Falling below the lower band can reflect forceful selling, but it is not by itself proof that the price must rebound. ATR of $7.00, or 2.9% of the share price, indicates moderate volatility; the latest drop was large relative to that typical range. Volume makes the fall harder to dismiss as a low-participation move. The 83,559,600 shares traded were 2.2 times the 20-session average of 38,026,355, while OBV declined. OBV, or on-balance volume, tracks whether trading volume tends to accompany advances or declines. Its fall alongside the price points to selling participation rather than clear accumulation. Support is $243.79, while resistance is $262.63. Holding support would leave room for a stabilization attempt, particularly if the Stochastic improves and MACD pressure eases. A break below support would weaken that case and expose the broader three-month low at $231.06. On the upside, a recovery would first need to confront the moving averages near $255; the stated resistance at $262.63 marks a higher hurdle.Technical Verdict: HOLD (wait & see)
The indicators support a wait-and-see technical reading, not a directional confirmation. The reasons are the golden cross formed one session before the latest session, offset by price below both moving averages; negative MACD momentum; and high-volume selling with OBV declining. The oversold Stochastic could signal that selling is stretched, but it does not yet outweigh those warnings. - Ideal entry range: $243.79–$254.95, bounded by stated support and the 20-day average; this is a technical reference range, not a recommendation. - Exit target: $262.63, the stated 20-session resistance. - Stop-loss protection: $243.79, the stated support; a decisive break below it would invalidate this verdict. In plain English, the chart has a recent bullish crossover, but the latest heavy selling leaves the direction unresolved.Summary Data AMZN
| Last price | 243.79 USD |
| Change 1 day / 5 days / 1 month | -4.25% / -2.63% / -1.79% |
| Trend / MA-cross | sideways / golden |
| SMA20 / SMA50 | 254.95 / 254.67 |
| RSI (14) / Stochastic %K | 41.3 / 10.6 |
| Bollinger %B / ATR | -2% / 7.00 |
| Support / Resistance 20 days | 243.79 / 262.63 |
| Data as of | 30 October 2026 03:00 WIB |
Disclaimer: This technical analysis is generated automatically from exchange data and indicators calculated by JournalArta, for information and education only. The verdict and the entry, target and stop-loss levels are not investment advice or a solicitation to buy or sell any security. Investment decisions and their risks rest solely with the reader.
Track AMZN stock price daily: live levels, support/resistance and our full AMZN analysis history.