NVDA Stock Drops 0.80%, Testing Support Level In Focus
On October 29, 2026: price 213.66 USD, trend sideways, RSI 42.7, support 210.96, resistance 239.24. technical analysis of nvda stock. NVDA Stock Drops — full…
By Elena Vance
October 30, 20264 min read
NVDA Stock Drops 0.80%, Testing Support Level In Focus
Nvidia fell 0.80% on the Nasdaq to $213.66 in Thursday’s session, October 29, as its price stayed below both the 20-day and 50-day moving averages and trading volume remained below its recent norm. The move was modest. But the indicators show a stock under pressure, with short-term selling momentum not yet matched by a decisive break of support.
Trend & Price Action
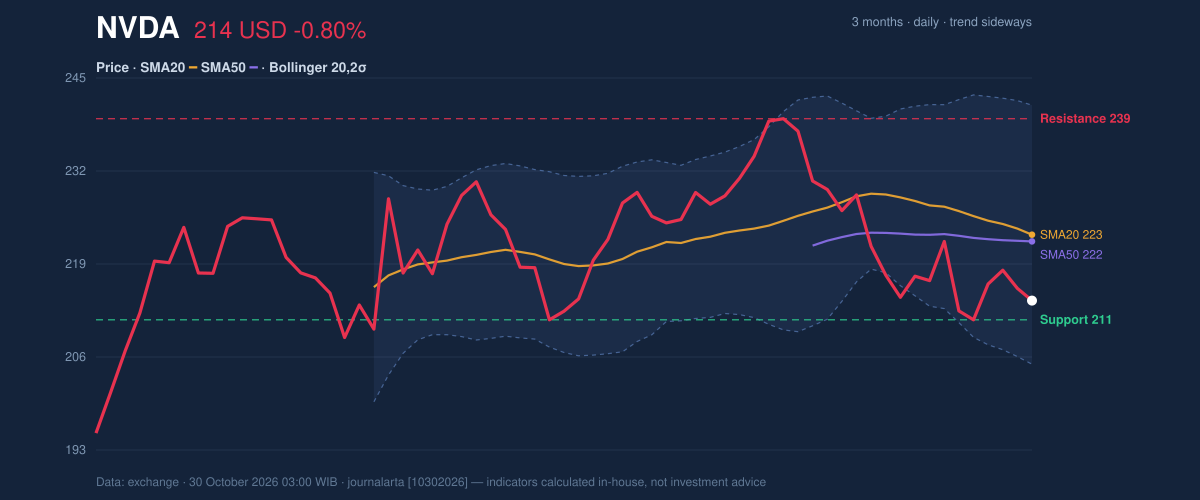
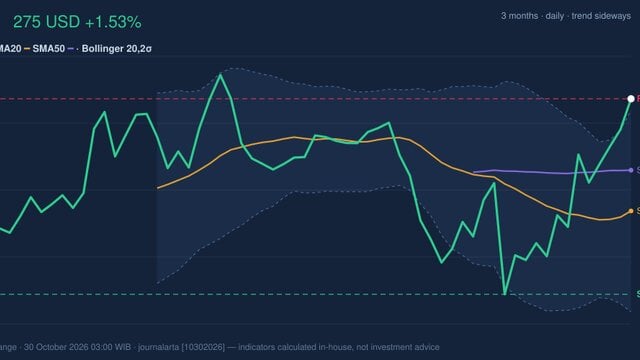
NVDA’s last price of $213.66 was below its 20-day average of $222.93 and its 50-day average of $221.99. The 20-day average has fallen 1.47% over five days, a sign that the short-term trend is weakening rather than stabilizing. No new moving-average crossover has formed, so there is no fresh signal from the relationship between the two averages.
The stock is near the lower end of its 20-day trading range: $210.96 support and $239.24 resistance, with the price in the bottom 10% of that span. That positioning can make a rebound more plausible if support holds, but it also leaves little room for a routine decline before the market tests that level. Over the past three months, NVDA has ranged from $191.52 to $243.37.
As shown in the chart, the lower Bollinger band is at $204.72, while the middle band is $222.93. Bollinger bands map a stock’s recent range of movement; the 25% reading for NVDA places the price closer to the lower band than the upper one. The band width is 16.3%, described as normal, so the data do not point to an unusually compressed trading range that might precede a sharp breakout.
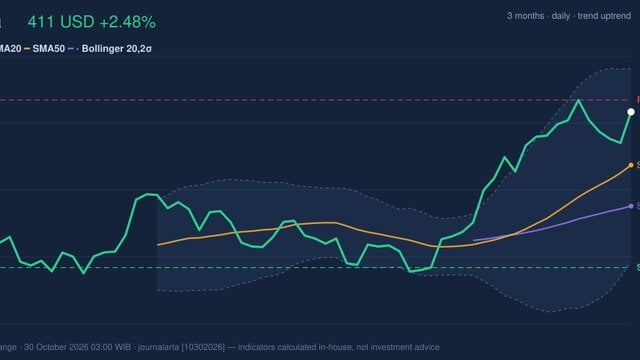
3-month price action chart of NVDA: price, SMA20/50, Bollinger, support & resistance.
Oscillators & Momentum
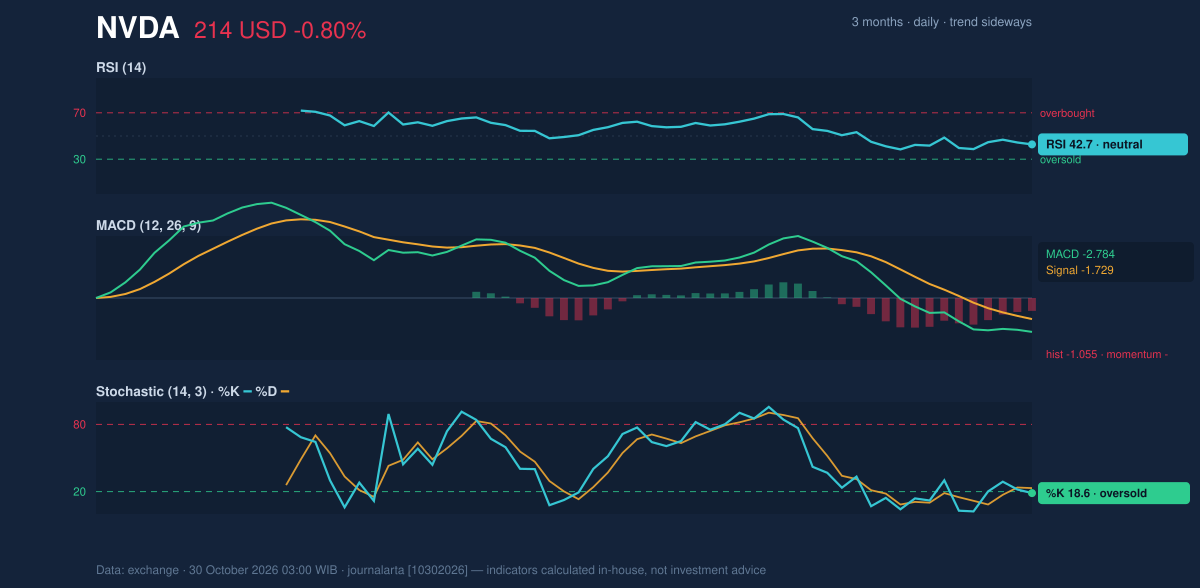
Momentum measures are mixed, but the balance leans negative. The RSI is 42.7, a neutral reading, meaning it does not by itself indicate an extreme in either direction. The Stochastic reading is more stretched: %K at 18.6 and %D at 23.1 are in oversold territory. This can occur when declines have been persistent; it is not, on its own, evidence that a reversal has begun.
The MACD is negative at -2.784, below its -1.729 signal line, with a -1.055 histogram. MACD compares shorter- and longer-term price momentum. Its position here suggests downward momentum remains in control, which tempers the potential significance of the oversold Stochastic reading. A stronger reversal case would require signs that selling pressure is easing rather than simply a low oscillator reading.
Momentum chart of NVDA: RSI(14), MACD, Stochastic.
Volatility & Volume
Average true range, a measure of typical daily movement, stands at $5.94, or 2.8% of the share price—moderate volatility. That matters near support: ordinary price fluctuations can be large enough to test the $210.96 level without necessarily establishing a sustained breakdown.
Participation was subdued. Volume of 76,216,000 shares was 0.8 times the 20-day average of 99,340,320, while on-balance volume, which tracks whether volume accompanies rising or falling prices, was declining. The combination suggests the latest drop did not occur on unusually heavy turnover, but it also offers little confirmation that buyers are stepping in. The 5-day gain of 0.68% has not reversed the 1-month decline of 7.45%.
Key Levels & Scenarios
Support at $210.96 is the near-term test. If NVDA holds there, oversold Stochastic readings could be consistent with a recovery toward the moving averages, around $222. If price falls below support, the lower Bollinger band at $204.72 becomes a relevant next reference, though the data do not establish that it must be reached.
On the upside, $222.93–$221.99 is the moving-average zone, where the 20-day and 50-day averages converge. A sustained move above it would improve the short-term price structure; $239.24 is the 20-day resistance beyond that. Until price recovers above the averages, the negative MACD and falling 20-day average argue against reading a low Stochastic value as a confirmed turn.
Technical Verdict: HOLD (wait & see)
HOLD (wait & see) best reflects the conflicting signals: price is below both moving averages and MACD momentum is negative, while Stochastic is oversold and the share price is close to defined support. Declining OBV and below-average volume provide no strong evidence of renewed buying participation. The verdict is invalidated if price breaks below $210.96 support.
Ideal entry range: $210.96–$222.93, bounded by 20-day support and the 20-day average.
Exit target: $239.24, the 20-day resistance level.
Stop-loss protection: $204.72, the lower Bollinger band.
In plain English, the indicators favor waiting for support or a recovery above the moving averages to clarify the direction.
Metric
Reading
Latest price
$213.66
One-day / five-day / one-month change
-0.80% / 0.68% / -7.45%
SMA20 / SMA50
$222.93 / $221.99
RSI / Stochastic
42.7 / 18.6 (%K), 23.1 (%D)
MACD / signal / histogram
-2.784 / -1.729 / -1.055
20-day support / resistance
$210.96 / $239.24
Summary Data NVDA
Last price
213.66 USD
Change 1 day / 5 days / 1 month
-0.80% / 0.68% / -7.45%
Trend / MA-cross
sideways / none
SMA20 / SMA50
222.93 / 221.99
RSI (14) / Stochastic %K
42.7 / 18.6
Bollinger %B / ATR
25% / 5.94
Support / Resistance 20 days
210.96 / 239.24
Data as of
30 October 2026 03:00 WIB
Disclaimer: This technical analysis is generated automatically from exchange data and indicators calculated by JournalArta, for information and education only. The verdict and the entry, target and stop-loss levels are not investment advice or a solicitation to buy or sell any security. Investment decisions and their risks rest solely with the reader.