BP Stock Technicals Today: Gains 1.08%, Testing Key Resistance
On September 15, 2026: price 571.20 GBp, trend uptrend, RSI 64.7, support 514.50, resistance 565.10. technical analysis of bp stock. BP Stock Technicals — full…

BP plc is pressing against the top of its recent trading range, and that matters because the shares are now being priced for momentum rather than caution. The London-listed oil major closed at 571.20 GBp, up 1.08% on the day and 9.34% over the past month, according to Yahoo Finance data for 11 September 2026 at 14:00 WIB. That move places BP just below its 3-month high of 572.50, which is the kind of level that often tests whether a rally is being driven by fresh demand or simply stretching into overbought territory.
The chart shows a stock that is still in an uptrend, but one that is beginning to look mature rather than effortless. BP is trading above SMA20 at 538.92 and above SMA50 at 526.73, which tells investors the short- and medium-term trend remain aligned in the bulls’ favour. The SMA20 slope of 1.44% over five days reinforces that the recent advance is still rising, not flattening out. There is no new MA-cross, so the message is continuity rather than a fresh technical trigger. In plain terms: the trend is already established, and the market is now asking whether it can keep climbing without a pause.
Trend & Price Action
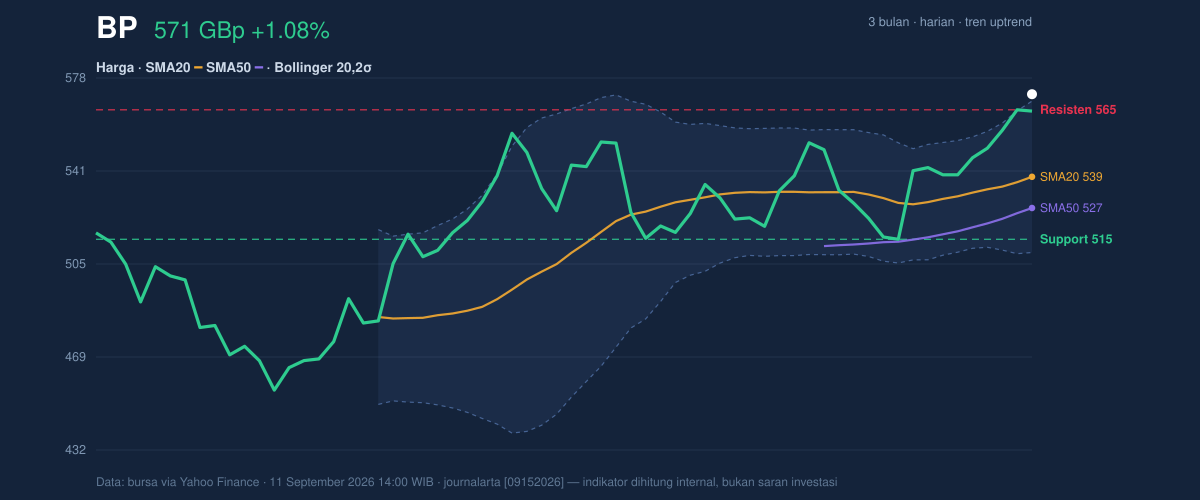
Price structure is important here because BP is not merely above its moving averages; it is also trading at 112% of the 20-hour range, with the latest print at 571.20 GBp versus resistance at 565.10 and a nearby 3-month high at 572.50. That combination signals a market pushing into discovery mode: when a share sits above a prior resistance band, traders often look to see whether that old ceiling becomes a new floor. If it does, the breakout can attract follow-through. If it does not, the move can quickly turn into a false break.
The Bollinger setup supports that reading. BP is trading above the upper band at 568.48, with %B at 105%, meaning the share has moved beyond the usual statistical envelope of the last 20 sessions. That does not automatically mean reversal, but it does mean the price is extended relative to recent history. The band width is 11.0%, described as normal, so this is not a volatility squeeze waiting to explode; it is a fairly standard environment in which price is already pressing the upper boundary.
Oscillators & Momentum
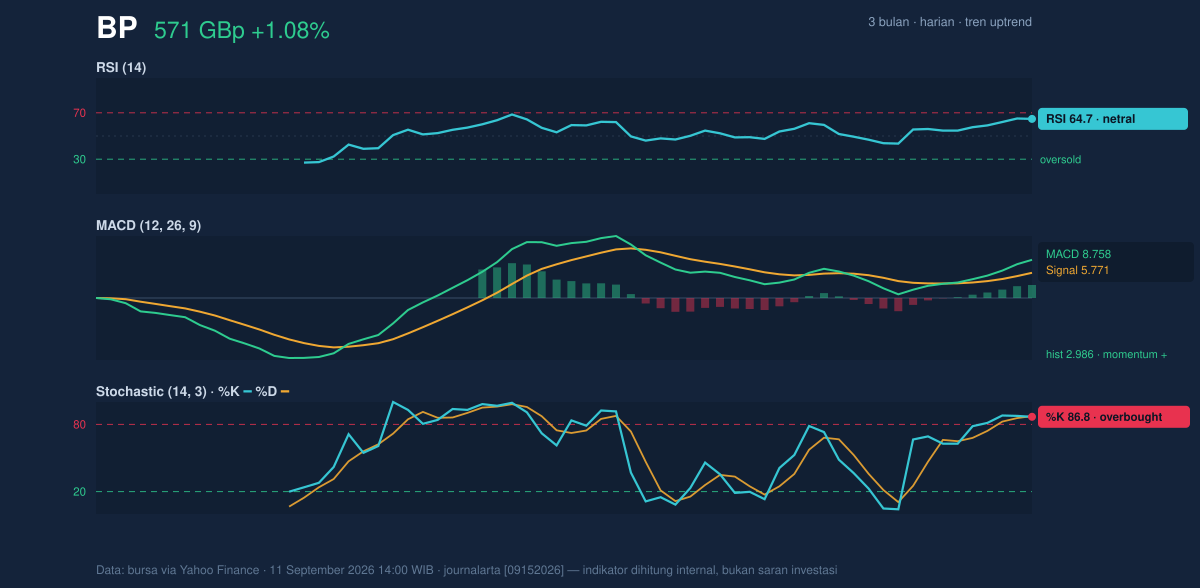
Momentum indicators are split in a useful way. The RSI at 64.7 is still classed as neutral, which means the rally has not yet moved into the classic overbought zone that would normally raise stronger caution. But the Stochastic %K at 86.8 and %D at 87.4 are both overbought, and that matters because Stochastics tend to react faster than RSI. In practice, this says the latest push has been strong and quick, but it may also be getting ahead of itself in the short term.
The MACD picture is more constructive. With MACD at 8.758 above the signal line at 5.771, and a positive histogram of 2.986, momentum is still expanding rather than fading. That is the clearest bullish signal in the set: the trend has not only held, but the rate of advance is still positive. The key nuance is that momentum and stretch are now coexisting. That usually means traders are watching closely for either a continuation breakout or a brief consolidation to cool the oscillators without damaging the trend.
Volatility & Volume
Volatility is moderate rather than dramatic. ATR(14) at 16.24, or 2.8% of price, suggests BP can still move meaningfully in a session, but not in a disorderly way. The 11.0% Bollinger width also points to a normal volatility regime, which is important because it means the recent rise is not being driven by an unusual expansion in price swings.
Participation, however, is less convincing. The latest volume of 25,225,408 is only 0.6x the 20-hour average of 45,122,581, so the advance is happening on quieter-than-usual trading. That is not a bearish signal by itself, but it does weaken the conviction behind the move. In technical analysis, price rising on light volume can mean fewer sellers are present, or it can mean fewer buyers are willing to chase the move at higher levels. The OBV is rising, which offsets some of that concern by showing that cumulative buying pressure has still been improving. Put together, the volume profile says the rally has support, but not yet the kind of broad participation that usually confirms a major breakout.
Key Levels & Scenarios
The most important levels are now very clear. Immediate support sits at 565.10, which is also the prior close and the top of the recent range. Below that, the next major support is 514.50, a much deeper floor that would only matter if the current breakout attempt failed decisively. On the upside, resistance is 572.50, matching the 3-month high. That makes the current area a critical test: the share is effectively knocking on the door of its highest point in three months.
If BP holds above 565.10 and then clears 572.50, the chart would confirm that the market is willing to price the stock beyond its recent ceiling. If it fails to hold 565.10, the move looks more like an overextension and could slip back toward the Bollinger middle at 538.92. A deeper loss of 514.50 would do more damage to the current bullish structure, because it would place price back inside the broader range rather than at the top of it.
Technical Verdict: HOLD (wait & see)
Verdict: HOLD (wait & see)
- MACD remains positive and the histogram is still above zero, which supports the uptrend.
- Price is above SMA20 and SMA50, so the broader structure is still constructive.
- Stochastic is overbought and price is already above the upper Bollinger band, which argues for caution near resistance.
Verdict invalidated if price falls below 514.50, because that would break the nearest major support and weaken the current trend structure.
- Ideal entry range: 565.10 to 568.48
- Exit target: 572.50
- Stop loss protection: 514.50
For non-traders: BP is still technically strong, but it is already near a level where rallies often pause or reverse, so the chart is asking for confirmation rather than enthusiasm.
Summary Data BP
| Last price | 571.20 GBp |
| Change 1 day / 5 days / 1 month | 1.08% / 5.84% / 9.34% |
| Trend / MA-cross | uptrend / none |
| SMA20 / SMA50 | 538.92 / 526.73 |
| RSI (14) / Stochastic %K | 64.7 / 86.8 |
| Bollinger %B / ATR | 105% / 16.24 |
| Support / Resistance 20 days | 514.50 / 565.10 |
| Data as of | 11 September 2026 14:00 WIB |

