Alibaba Stock Technicals Today: Gains 11.99%, Testing Key Resistance
On Agustus 4, 2026: price 125.20 HKD, trend sideways, RSI 58.8, support 95.80, resistance 117.00. technical analysis of alibaba stock. Alibaba Stock Technicals…
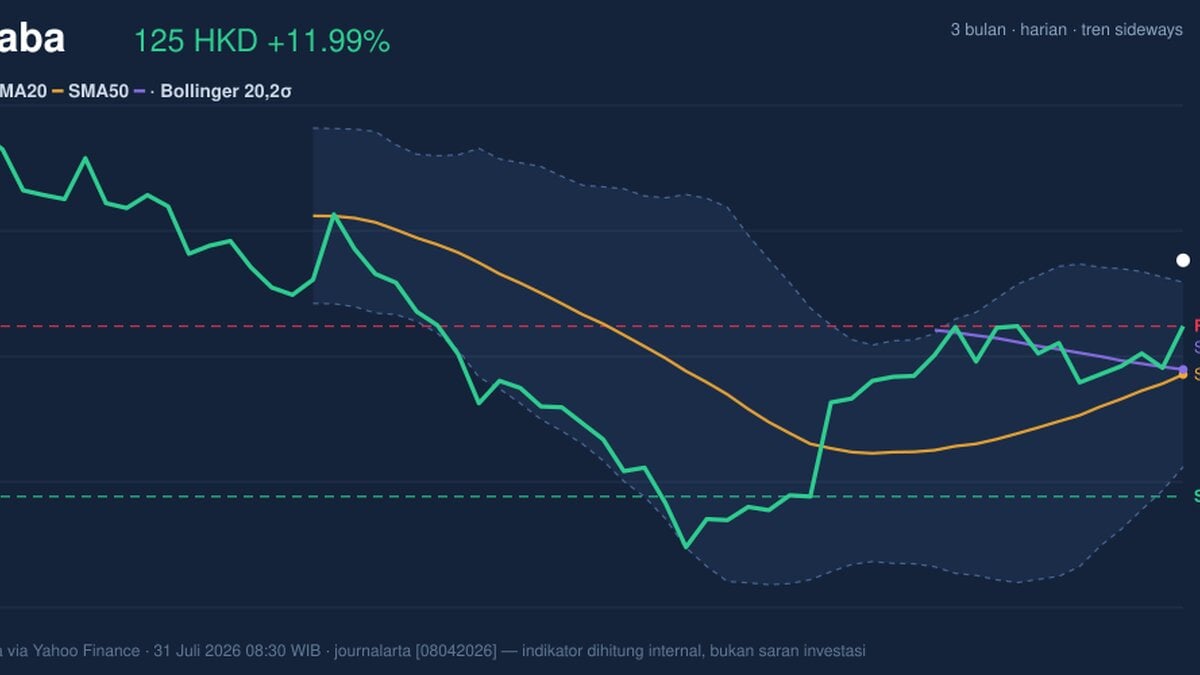
Alibaba Group’s Hong Kong-listed shares rose to HKD 125.20 on the HKEX, up from a previous close of HKD 111.80, after a move that pushed the stock well beyond its near-term trading band and into the upper edge of its volatility envelope, according to exchange-tracked data as of 31 July 2026 08:30 WIB. The price action matters because it is not just a one-day jump: the stock is up 11.99% in 1 day, 13.82% in 5 days, and 33.05% over 1 month, a sequence that signals sustained buying rather than a single burst of enthusiasm.
Trend & Price Action
The chart shows a stock that has shifted from a low-volatility, range-bound pattern into a stronger upward phase, even though the broader label remains sideways. That may sound contradictory, but it is a useful signal: the trend classification reflects the longer structure, while the recent slope of SMA20 at 4.79% over 5 days shows momentum has turned up sharply in the short term. The share price is now above SMA20 at HKD 110.98 and also above SMA50 at HKD 111.61, which tells readers the market has reclaimed both short- and medium-term averages. There is no new MA-cross, so this is not yet a fresh moving-average breakout story; instead, it is a rebound that has accelerated without the classic “golden cross” confirmation.
That distinction matters. A stock above both moving averages is usually a sign that traders are paying up for the recent tape, but without a new cross the move still needs follow-through to prove durability.
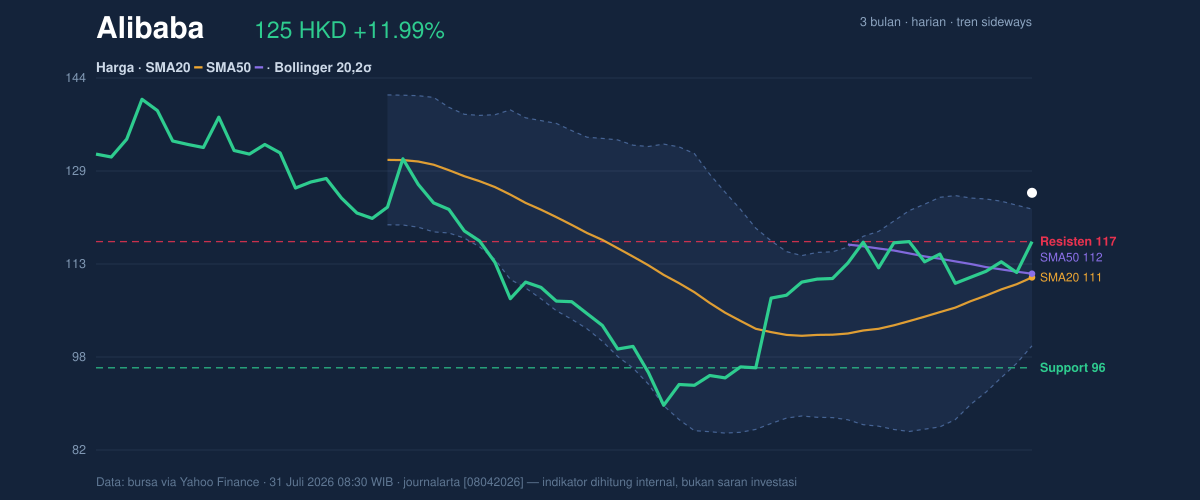
The price is also sitting at 139% of the 20-hour range, with 20-hour support at HKD 95.80 and 20-hour resistance at HKD 117.00. In plain English, the market has already moved through the ceiling of its recent trading band and is now trying to establish a new one. The fact that the stock is trading above the upper band of that range suggests the market has entered a discovery phase, where the next reference points are less about the old range and more about whether the new higher level can hold.
Oscillators & Momentum
Momentum indicators are mostly constructive, but not stretched enough to scream exhaustion. RSI(14) at 58.8 is still neutral, which means the stock has room to run before it reaches the kind of overheated reading that often precedes a pause. At the same time, Stochastic %K at 71.4 versus %D at 51.0 is also neutral, but it leans firmer than RSI and shows short-term momentum is ahead of its slower signal line. That gap often appears when a move is gaining traction, though it can also flag that the stock is approaching a zone where traders begin to lock in gains.
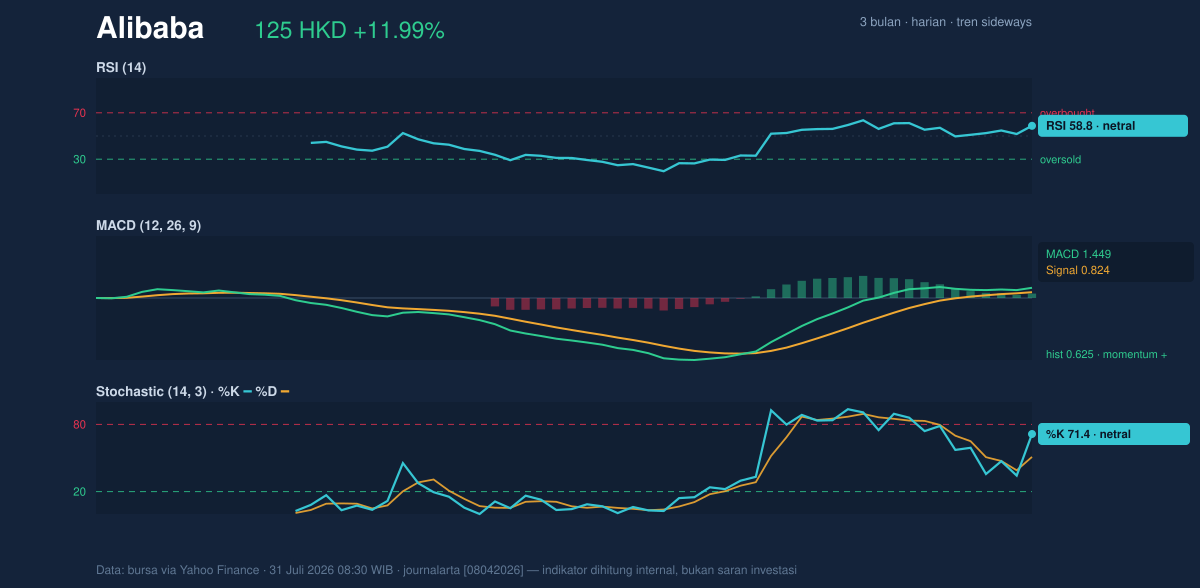
The cleaner signal comes from MACD. MACD at 1.449 sits above the signal line at 0.824, with a histogram of 0.625, which means the trend’s internal momentum is still positive. In practical terms, MACD above signal line suggests the recent price advance has enough force behind it to stay alive for now. It does not guarantee continuation, but it does show the move is being supported by trend-following momentum rather than just a brief spike.
Volatility & Volume
Volatility is elevated, and that changes how the price should be read. The Bollinger Bands are widening, with the upper band at HKD 122.46, the middle band at HKD 110.98, and the lower band at HKD 99.49. The stock’s %B at 112% means price is trading above the upper band, which usually signals strong upside pressure but also a higher risk of short-term mean reversion — in other words, the move has become fast enough that some traders may start to question whether it has run ahead of itself. The 20.7% band width confirms a volatility expansion, not a squeeze, so the market is not coiling for a quiet phase; it is already in motion.
ATR(14) at 5.30, or 4.2% of price, reinforces that point. ATR measures the typical daily range, so a higher reading means larger swings are now normal rather than exceptional. Volume also supports the move: 144,668,807 shares changed hands versus a 20-hour average of 115,103,669, or about 1.3x normal, while OBV is rising. That combination matters because rising volume and rising on-balance volume usually indicate the advance has broad participation, not just thin trading.
The tape is active, not sleepy.
Key Levels & Scenarios
The nearest technical reference points now come from the upper Bollinger band and the old range ceiling. HKD 122.46 is the first level to watch as the upper band, while HKD 117.00 remains the prior 20-hour resistance that has already been cleared. On the downside, HKD 110.98 and HKD 111.61 are the moving-average cluster that should act as the first technical cushion, while HKD 99.49 is the lower Bollinger boundary and a deeper line of defense. The broader 3-month range, from HKD 88.65 to HKD 144.00, frames the stock’s current position: it is now closer to the upper half of that band, but still below the peak.
If the shares hold above the moving-average zone and continue to attract volume, the market can keep building a higher range. If they slip back under the averages, the recent breakout starts to look more like an overextended rally than a lasting shift.
Technical Verdict: HOLD (wait & see)
HOLD (wait & see) is the cleanest read from the current setup because momentum is positive, but price is already extended above the upper Bollinger band and the old resistance zone.
- Reason 1: MACD is positive and above its signal line, which supports the recent up-move.
- Reason 2: Price is above SMA20 and SMA50, showing the short- and medium-term structure has improved.
- Reason 3: %B at 112% and ATR at 5.30 indicate the stock is stretched and volatile, so follow-through is needed before the move can be treated as stable.
- Verdict invalidated if price falls below HKD 110.98, because that would put the shares back under the key moving-average support zone.
- Ideal Entry Range: HKD 110.98 to HKD 117.00
- Exit Target: HKD 122.46, then HKD 144.00
- Stop Loss protection: HKD 99.49
In plain English: the stock is strong, but it is already running hot, so the chart is asking for confirmation rather than chasing.
Summary Data Alibaba
| Last price | 125.20 HKD |
| Change 1 day / 5 days / 1 month | 11.99% / 13.82% / 33.05% |
| Trend / MA-cross | sideways / none |
| SMA20 / SMA50 | 110.98 / 111.61 |
| RSI (14) / Stochastic %K | 58.8 / 71.4 |
| Bollinger %B / ATR | 112% / 5.30 |
| Support / Resistance 20 days | 95.80 / 117.00 |
| Data as of | 31 Juli 2026 08:30 WIB |
Track Alibaba share price daily: live levels, support/resistance and our full Alibaba analysis history.