BP Stock Technicals Today: Gains 1.69%, Golden Cross Formed
On Agustus 4, 2026: price 552.10 GBp, trend uptrend, RSI 63.2, support 467.80, resistance 555.90. technical analysis of bp stock. BP Stock Technicals — full…
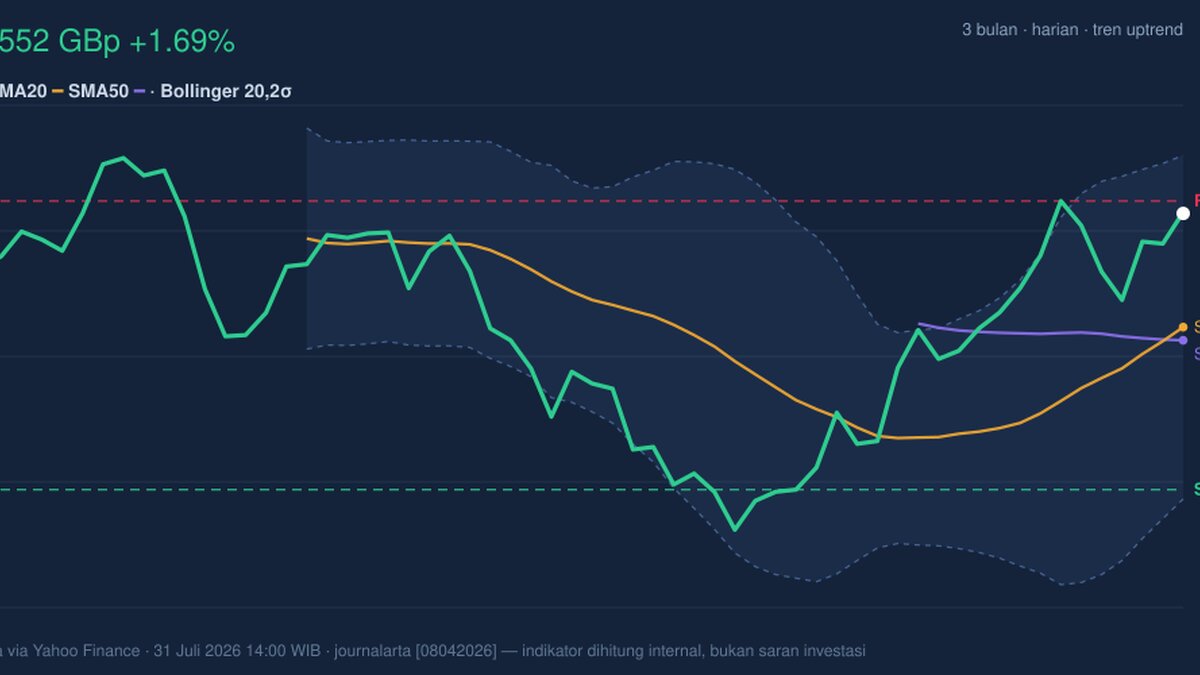
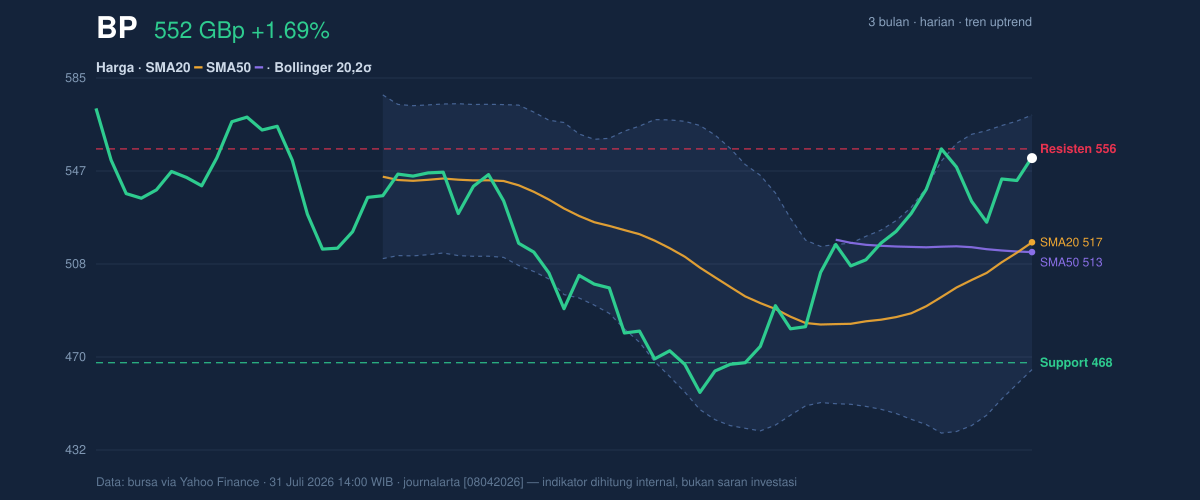
BP plc is pressing against the top of its recent trading range, and the message from the chart is clear: momentum is still positive, but the stock is now close enough to resistance that the next move matters more than the last one.
BP’s London-listed shares were last at 552.10 GBp on 31 July 2026 at 14:00 WIB, up 1.69% on the day and 18.18% over one month, according to exchange data cited via Yahoo Finance. That is a meaningful shift for a large-cap energy name because it shows the market is not merely drifting higher; it is repricing the stock with conviction after a sustained run. The key question now is whether that strength can extend beyond the near-term ceiling, or whether the move is getting stretched.
Trend & Price Action
The broader structure is constructive. BP is trading above SMA20 at 517.42 and above SMA50 at 513.39, while the moving-average setup has already completed a golden cross, meaning the shorter average has moved above the longer one. In plain terms, that usually signals that recent buying has become strong enough to change the trend narrative from recovery to trend continuation.
The slope of SMA20, at 3.73% over 5 days, reinforces that point: the trend is not just positive, it is still rising. As shown in the chart, price is now sitting near the upper end of the recent band, with support at 467.80 and resistance at 555.90. With the last price at 552.10 GBp, BP is effectively trading in the top slice of that range, close to the ceiling rather than the middle. That positioning matters because late-stage range strength can either become a breakout or invite short-term profit-taking.
The broader three-month map also frames the move well. BP is still below the 3-month high of 580.60, but comfortably above the 3-month low of 450.60. That tells readers the stock has recovered a large part of its prior drawdown, yet has not fully escaped the zone where sellers previously reappeared.
Oscillators & Momentum
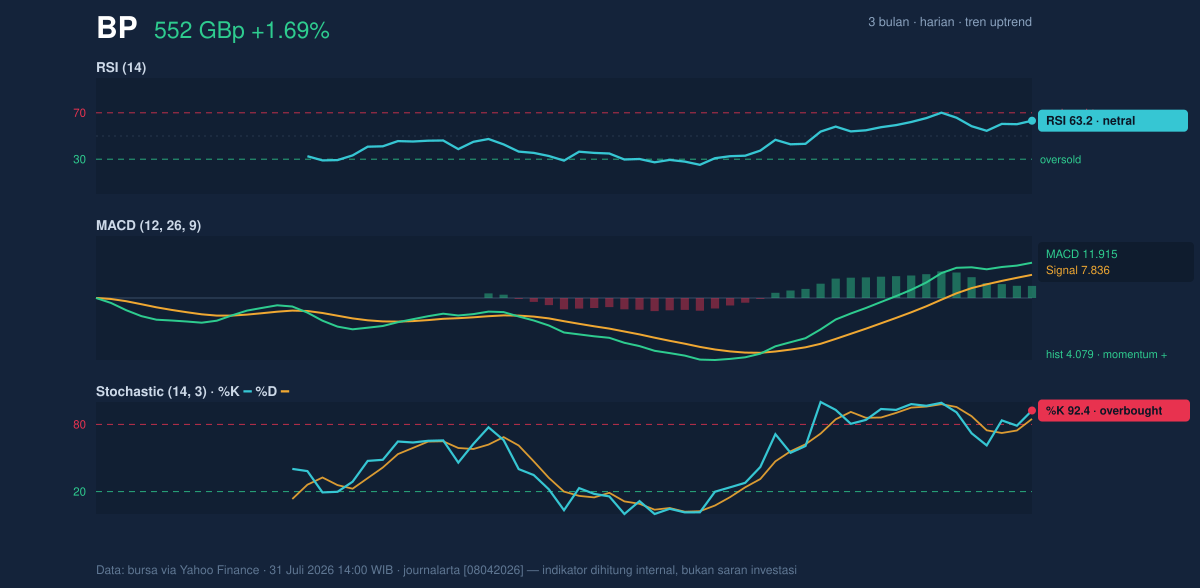
Momentum indicators are aligned, but not perfectly comfortable. The RSI at 63.2 is described as neutral, which means the stock is not yet in a classic overbought extreme. However, the Stochastic %K at 92.4 and %D at 84.9 are clearly overbought, a sign that the latest push has been fast and may be vulnerable to a pause even if the bigger trend remains intact. In practical terms, RSI says the trend still has room; Stochastic says the short-term move may already be crowded.
The MACD at 11.915 sits above its signal line at 7.836, with a positive histogram of 4.079. That is the cleanest confirmation in the dataset: the trend is not only rising, but the acceleration behind it remains positive. As shown in the momentum chart, MACD is still supporting the advance even as Stochastic warns that the stock may need to cool off before any further leg higher.
Volatility & Volume
Bollinger Bands add an important nuance. The upper band sits at 569.87, the middle band at 517.42, and the lower band at 464.96. With %B at 83%, BP is trading high in the band structure, which usually means price is leaning toward the upper envelope rather than sitting in the middle. At the same time, the 20.3% band width shows the bands are expanding, a classic sign that volatility is rising rather than compressing. That combination often accompanies trend continuation, but it also means the stock can move sharply in either direction once it reaches a crowded area.
ATR(14) at 14.11, or 2.6% of price, suggests volatility is moderate rather than extreme on a daily basis. So while the Bollinger structure signals a wider trading environment, the average daily swing is still contained enough that nearby support and resistance should remain relevant over the next few sessions.
Volume does not yet scream breakout. Last volume was 37,026,346 versus a 20-session average of 38,450,103, or roughly 1.0× normal. That means the latest rise has not been powered by an obvious surge in participation. Still, OBV is rising, which is important: on-balance volume measures whether money flow has been quietly accumulating over time. A rising OBV alongside a rising price usually supports the idea that buyers are gradually in control, even if the latest session was not unusually heavy.
Key Levels & Scenarios
The immediate battleground is tight. Resistance at 555.90 is only a few points above the last price, while support at 467.80 remains the deeper floor from the 20-session range. The practical near-term reference is the Bollinger upper band at 569.87, which sits just above resistance and marks the zone where the current advance would begin to look stretched.
If BP clears 555.90 on firm participation, the chart opens toward the 569.87 upper Bollinger band and then the 580.60 three-month high. If it fails to hold the current high zone, the first signal of fatigue would be a drift back toward the 517.42 mid-band and SMA20 area, where trend support should be tested. A deeper loss of that zone would weaken the recent breakout structure and raise the odds of a move back toward 513.39 and then 467.80.
Technical Verdict: HOLD (wait & see)
HOLD (wait & see) — the trend is positive, but price is already near resistance and short-term momentum is overbought.
- MACD is positive and above its signal line, which confirms trend strength.
- Golden cross plus price above SMA20 and SMA50 supports the broader uptrend.
- Stochastic is overbought and price is near 555.90 resistance, so upside follow-through needs confirmation rather than assumption.
Verdict invalidated if price falls below 517.42.
- Ideal Entry Range: 517.42 to 527.00, where the SMA20 and Bollinger middle band sit.
- Exit Target: 569.87 to 580.60, using the upper Bollinger band and the 3-month high.
- Stop Loss protection: 513.39, with deeper technical risk increasing below 467.80.
In plain English: BP is still in an uptrend, but it is close enough to resistance that the chart is asking for confirmation before the next leg higher.
The next market test is whether the shares can close decisively above 555.90, with the 3-month high at 580.60 now the next visible reference on the chart.
Summary Data BP
| Last price | 552.10 GBp |
| Change 1 day / 5 days / 1 month | 1.69% / 0.67% / 18.18% |
| Trend / MA-cross | uptrend / golden |
| SMA20 / SMA50 | 517.42 / 513.39 |
| RSI (14) / Stochastic %K | 63.2 / 92.4 |
| Bollinger %B / ATR | 83% / 14.11 |
| Support / Resistance 20 days | 467.80 / 555.90 |
| Data as of | 31 Juli 2026 14:00 WIB |
Track BP share price daily: live levels, support/resistance and our full BP analysis history.