DBS Stock Drops 0.53% Today, Testing Key Resistance
On Agustus 4, 2026: price 74.45 SGD, trend uptrend, RSI 69.9, support 66.91, resistance 75.00. technical analysis of dbs stock. DBS Stock Drops — full details…
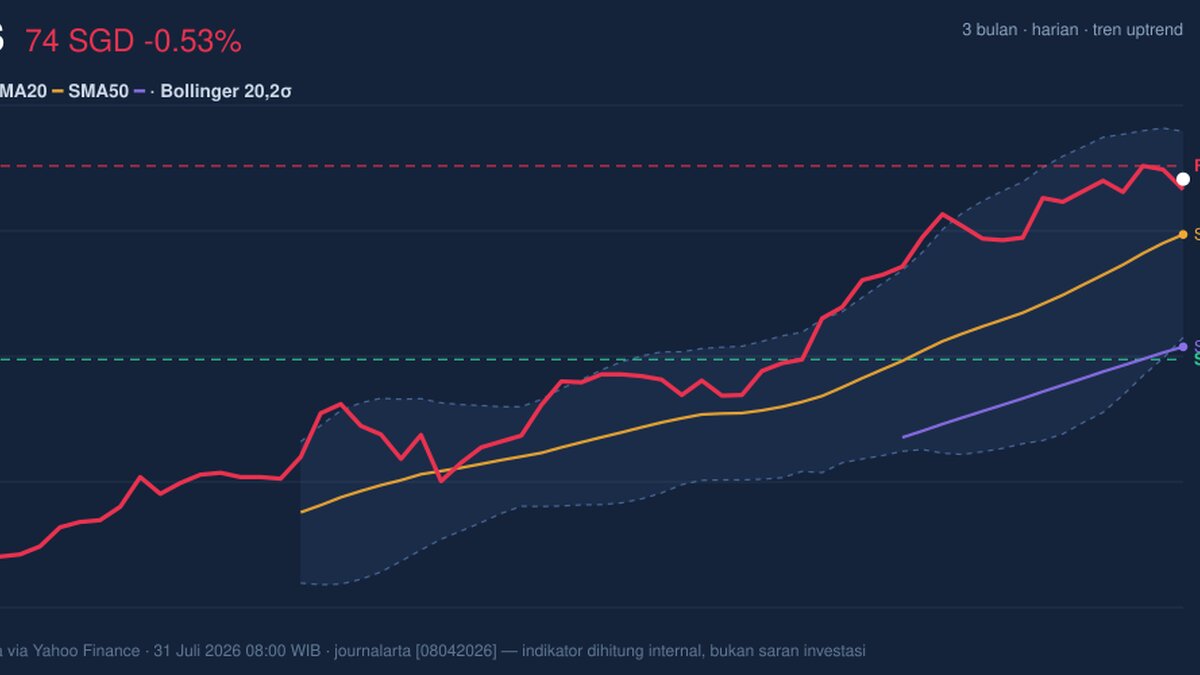
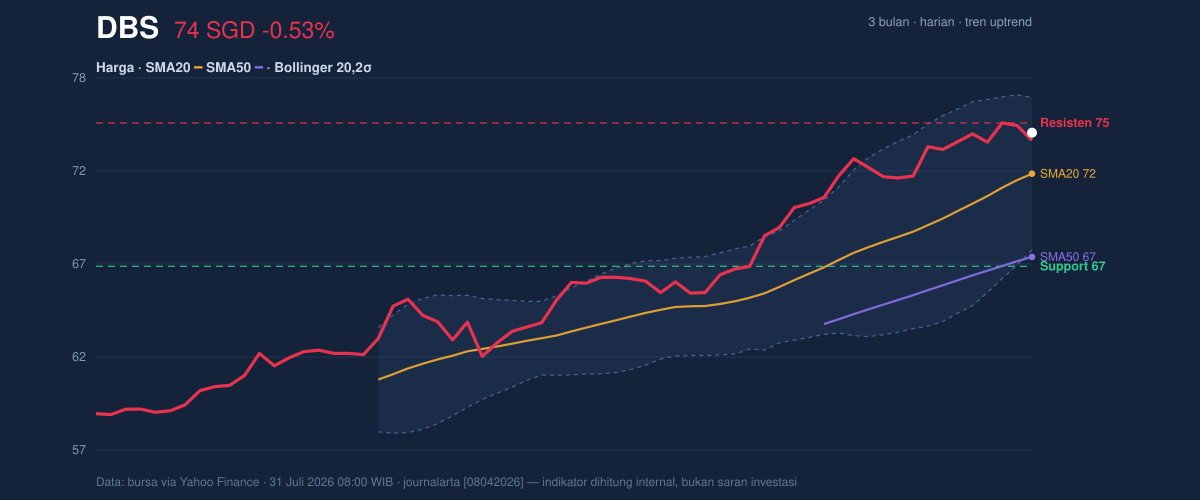
DBS Group’s shares slipped to SGD 74.45 on 31 July 2026, down 0.53% from the previous close of SGD 74.85, but the broader message from the chart is still constructive: the stock is trading above its SMA20 at SGD 72.14 and well clear of its SMA50 at SGD 67.44, keeping the medium-term trend pointed higher. The catch is that the latest push has brought DBS to the edge of its recent range, with price sitting near 93% of the 20-hour range and just under the 3-month high of SGD 75.00, where the market has already started to show some hesitation.
Trend & Price Action
The structure remains bullish, but not without strain. The uptrend is still intact, helped by the SMA20 slope of 3.01% over 5 days, which signals that the short-term average is rising at a healthy pace rather than flattening out. That matters because a rising SMA20 often acts like a moving floor under the share price, showing that buyers have been willing to pay up on dips. The fact that DBS is also holding above the SMA50 reinforces that this is not just a short-lived bounce; the stock has recovered enough to sit in a higher trading band.
Still, the market is no longer in the easy part of the move. The share price is pressing against the SGD 75.00 resistance, which is also the 3-month high. When a stock reaches its recent peak, the question changes from “is the trend up?” to “is there enough conviction to push through?” The answer is not yet clear, especially with volume and momentum sending mixed signals.
A small pullback here would not automatically damage the trend. But a failure to hold the lower band would tell a different story.
Oscillators & Momentum
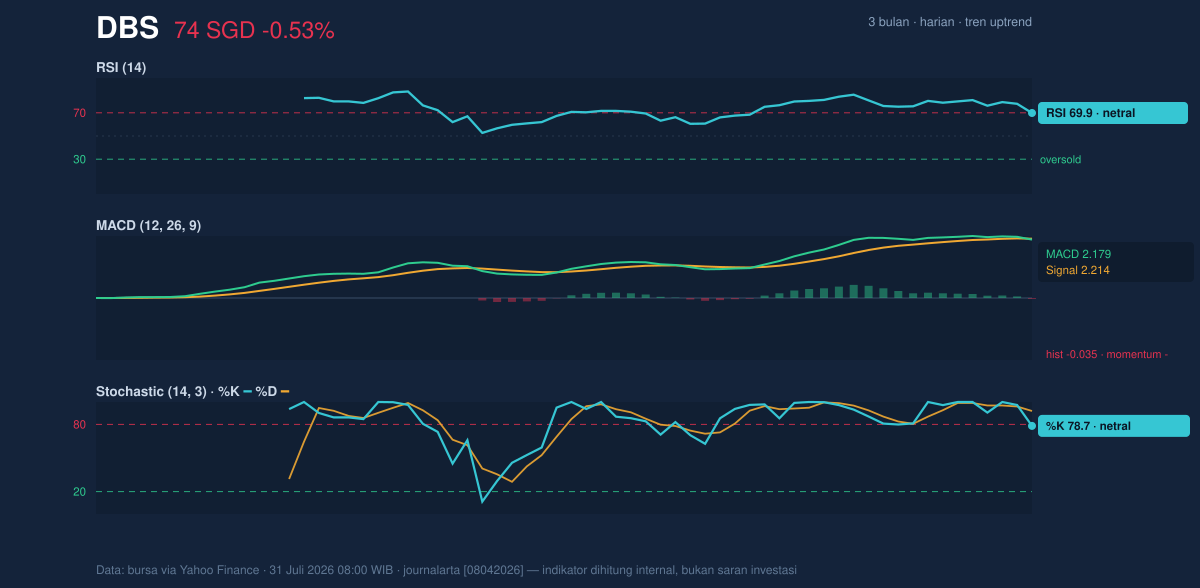
The momentum picture is more cautious than the price trend. RSI at 69.9 is still described as neutral in this data set, but it sits close to the line that often separates firm momentum from stretched conditions. In plain language, that means the stock has been strong enough to attract buyers, yet not so weak that it has lost its uptrend. The Stochastic %K at 78.7 and %D at 92.0 also point to a market that is elevated within its recent trading band, though still labelled neutral here. The key detail is that both oscillators are high, which usually means the stock is trading near the upper end of its recent range and may need either a pause or fresh buying interest to keep climbing.
The more important warning comes from MACD at 2.179 versus the signal line at 2.214, with a histogram of -0.035. That negative histogram means short-term momentum has slipped just below the trend signal. It is not a full reversal, but it does show that the latest advance is losing a little force. In technical terms, price is still strong while momentum is beginning to cool — a classic early warning that upside may become more selective unless the stock clears resistance decisively.
That mix matters more than any single indicator.
Volatility & Volume
Volatility is moderate rather than explosive. The ATR(14) of 1.20, equal to 1.6% of price, suggests typical daily movement is contained enough for orderly trading, not panic swings. Bollinger Bands tell a similar story: the upper band at SGD 76.44, middle band at SGD 72.14, and lower band at SGD 67.83 frame the current price as sitting above the midpoint and closer to the top of the band. With %B at 77%, DBS is trading in the upper portion of its recent volatility envelope, which usually means the market is leaning bullish but also closer to the point where gains can become harder to extend without a fresh catalyst.
The Bollinger band width of 11.9% is normal, not squeezed. That is important because a squeeze often warns of an imminent breakout or breakdown; here, the market is already moving in a fairly standard range, so the next move is more likely to depend on whether buyers can absorb supply near resistance. Volume adds a subtle caution: last volume was 5,296,900, about 1.2× the 20-hour average of 4,415,071, which shows participation improved, but OBV is down. OBV, or on-balance volume, tracks whether volume is flowing into the stock or out of it; a falling OBV while price holds up can mean the rally is not being fully supported underneath.
The tape is active, but not fully convincing.
Key Levels & Scenarios
The market is now boxed between a nearby ceiling and a deeper floor. The immediate ceiling is clear: SGD 75.00 resistance. Above that, the Bollinger upper band at SGD 76.44 becomes the next technical marker, showing where the stock would enter the upper edge of its recent volatility range. On the downside, the first major support sits at SGD 66.91, while the Bollinger lower band at SGD 67.83 offers a nearby technical cushion. The SMA20 at SGD 72.14 is the first trend line to watch on any retreat, because a loss of that level would suggest the current momentum is fading rather than merely pausing.
If DBS clears SGD 75.00 with conviction, the chart would shift from range pressure to continuation mode. If it fails there and slips back under the SMA20, the market would likely revert to a consolidation phase. A break below SGD 66.91 would be more serious, because it would place the stock back into the lower part of its 3-month range and weaken the current uptrend structure.
Technical Verdict: HOLD (wait & see)
HOLD (wait & see) fits best because the trend is still positive, but momentum is no longer fully aligned with price.
- Reason 1: The price remains above the SMA20 at SGD 72.14 and SMA50 at SGD 67.44, which keeps the trend constructive.
- Reason 2: MACD is below its signal line and the histogram is negative, showing momentum has softened even as price sits near resistance.
- Reason 3: The stock is trading near the top of its range, with %B at 77% and price close to SGD 75.00 resistance, so upside needs confirmation.
- Verdict invalidated if price breaks below SGD 66.91, which would weaken the current range structure and challenge the uptrend.
- Ideal Entry Range: SGD 72.14 to SGD 67.83
- Exit Target: SGD 75.00 to SGD 76.44
- Stop Loss protection: below SGD 66.91
In plain English, DBS is still trending higher, but it is now close enough to resistance that the next move needs proof rather than assumption.
“The market is asking whether DBS has enough fuel left to turn a near-high into a breakout.”
Summary Data DBS
| Last price | 74.45 SGD |
| Change 1 day / 5 days / 1 month | -0.53% / 0.69% / 11.52% |
| Trend / MA-cross | uptrend / none |
| SMA20 / SMA50 | 72.14 / 67.44 |
| RSI (14) / Stochastic %K | 69.9 / 78.7 |
| Bollinger %B / ATR | 77% / 1.20 |
| Support / Resistance 20 days | 66.91 / 75.00 |
| Data as of | 31 Juli 2026 08:00 WIB |
Track DBS share price daily: live levels, support/resistance and our full DBS analysis history.