HSBC RSI Overbought: Stock Gains 0.66% (Agustus 4, 2026)
On Agustus 4, 2026: price 1,597.40 GBp, trend uptrend, RSI 71.0, support 1,453.40, resistance 1,587.00. technical analysis of hsbc stock.
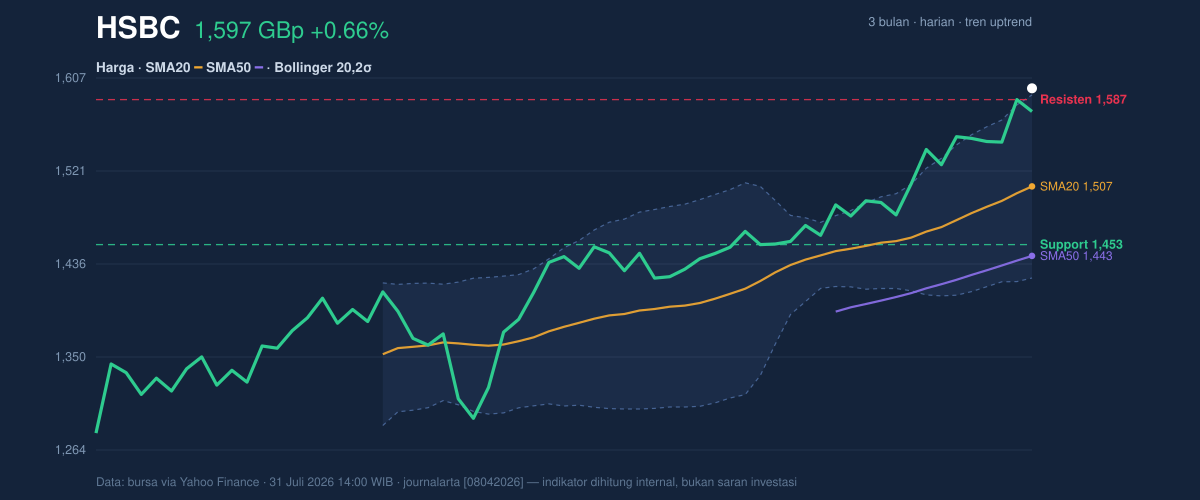
HSBC Holdings’ London shares were trading at 1,597.40 GBp at 14:00 WIB on 31 July 2026, edging above the previous close and pushing to within sight of the 3-month high of 1,604.60. The move leaves the stock at 108% of its 20-hour range, a technical way of saying it is trading beyond the recent ceiling rather than merely testing it. As shown in the chart, the share price is now sitting above its short- and medium-term trend markers, but the momentum readings are flashing a familiar warning: the rally is strong, and it is also stretched.
Trend & Price Action
The main message from the price structure is straightforward: HSBC remains in an uptrend, with the SMA20 at 1,506.98 and the SMA50 at 1,443.04 both below the current price. That gap matters because it shows buyers have been willing to pay progressively higher levels over the past several weeks, not just on one isolated session. The SMA20 slope of 2.10% over 5 days reinforces that the shorter trend is still rising, while the absence of a fresh MA-cross suggests the current advance is being driven by continuation rather than a new technical trigger.
The share is also trading above the Bollinger upper band at 1,591.29, which is a sign of strength but also of extension. When price pushes beyond the upper band, it often means the market is running hotter than usual and may need either a pause or a pullback before the next leg higher. That does not automatically mean reversal. It means the stock is no longer in a neutral zone.
Price is stretched, not broken.
Oscillators & Momentum
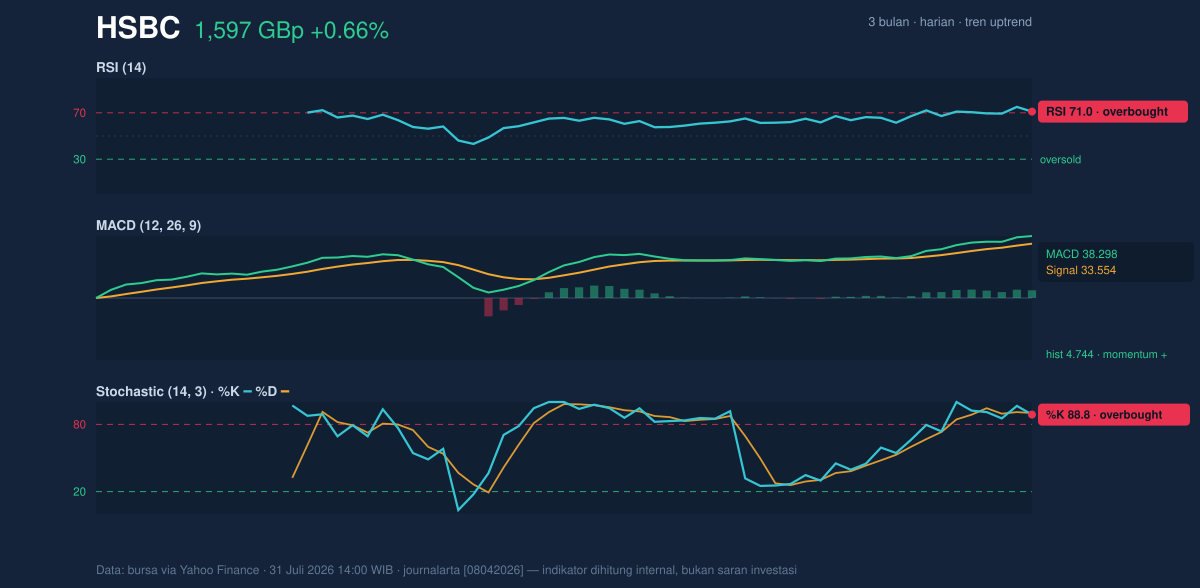
The momentum picture is where the tension shows up most clearly. The RSI at 71.0 and Stochastic %K at 88.8 / %D at 90.2 both sit in overbought territory. For general readers, that does not mean the share must fall immediately; it means the pace of buying has been fast enough that the market may be vulnerable to short-term cooling. In strong trends, overbought readings can persist longer than expected, but they still matter because they tell you the market is no longer cheap on a momentum basis.
What keeps the bullish case alive is the MACD at 38.298, above its signal line at 33.554, with a histogram of 4.744. That combination shows the trend’s internal engine is still positive: the shorter-term average is moving faster than the longer-term one, and the gap between them remains constructive. In plain English, the trend is still winning even though it is running near full speed.
So the oscillator setup is mixed, not contradictory. RSI and Stochastic say the move is extended; MACD says the trend has not yet lost its directional force.
Volatility & Volume
Volatility is not screaming. The ATR(14) at 39.69, equal to about 2.5% of price, points to moderate volatility. That matters because it suggests the stock is not in a panic phase or a disorderly breakout; instead, it is moving with enough daily range to matter, but not so much that the chart is unstable. The Bollinger band width of 11.2% is described as normal, which reinforces the idea that the recent push has not yet turned into an extreme volatility event.
Volume, however, is less confirming than price. The latest volume of 20,240,565 was only 1.0× normal, almost exactly in line with the 20-hour average of 20,156,528. That means the latest rise did not arrive with a dramatic surge in participation. More importantly, OBV is down, which is a subtle warning that cumulative volume pressure has not fully matched the price advance. When price rises while OBV falls, the market is saying the rally may be advancing without broad backing from volume accumulation.
That is not a bearish reversal signal by itself. It is a participation check.
Key Levels & Scenarios
The nearest technical reference points are clear. The 20-hour resistance at 1,587.00 has already been exceeded, which now turns it into a potential near-term support area if the breakout holds. Below that, the 20-hour support at 1,453.40 is the main downside marker from the data set, and it sits well above the SMA50 at 1,443.04. The stock’s position near the 3-month high of 1,604.60 means the market is operating close to a fresh ceiling, where traders often watch for either a clean extension or a failed breakout.
If HSBC holds above 1,587.00 and keeps momentum intact, the chart suggests the market is trying to convert old resistance into support. If it slips back below that level, the move starts to look more like an overextended run than a durable breakout. The deeper line in the sand is 1,453.40; losing that would damage the current trend structure and pull attention back toward the SMA50 at 1,443.04.
The breakout is real, but it still needs proof from follow-through.
Technical Verdict: HOLD (wait & see)
HOLD (wait & see)
- RSI at 71.0 and Stochastic %K/%D at 88.8/90.2 show the stock is overbought, so the move is extended.
- MACD above signal with a positive histogram of 4.744 shows trend momentum is still intact.
- Price is trading above the Bollinger upper band at 1,591.29 and near the 3-month high at 1,604.60, which supports strength but also raises the risk of a short-term pause.
Verdict invalidated if price falls below 1,453.40.
- Ideal Entry Range: 1,587.00 to 1,591.29
- Exit Target (Target Price): 1,604.60
- Stop Loss protection: 1,453.40
In plain English, HSBC is still trending higher, but the chart says the move is already extended and needs confirmation before it can be treated as steady rather than stretched.
Latest recorded 3-month high: 1,604.60.
Summary Data HSBC
| Last price | 1,597.40 GBp |
| Change 1 day / 5 days / 1 month | 0.66% / 2.87% / 10.09% |
| Trend / MA-cross | uptrend / none |
| SMA20 / SMA50 | 1,506.98 / 1,443.04 |
| RSI (14) / Stochastic %K | 71.0 / 88.8 |
| Bollinger %B / ATR | 104% / 39.69 |
| Support / Resistance 20 days | 1,453.40 / 1,587.00 |
| Data as of | 31 Juli 2026 14:00 WIB |
Track HSBC share price daily: live levels, support/resistance and our full HSBC analysis history.