HSBC RSI Overbought: Stock Gains 2.25% (Agustus 4, 2026)
On Agustus 4, 2026: price 168.20 HKD, trend uptrend, RSI 79.5, support 151.90, resistance 168.20. technical analysis of hsbc stock. HSBC RSI Overbought — full…
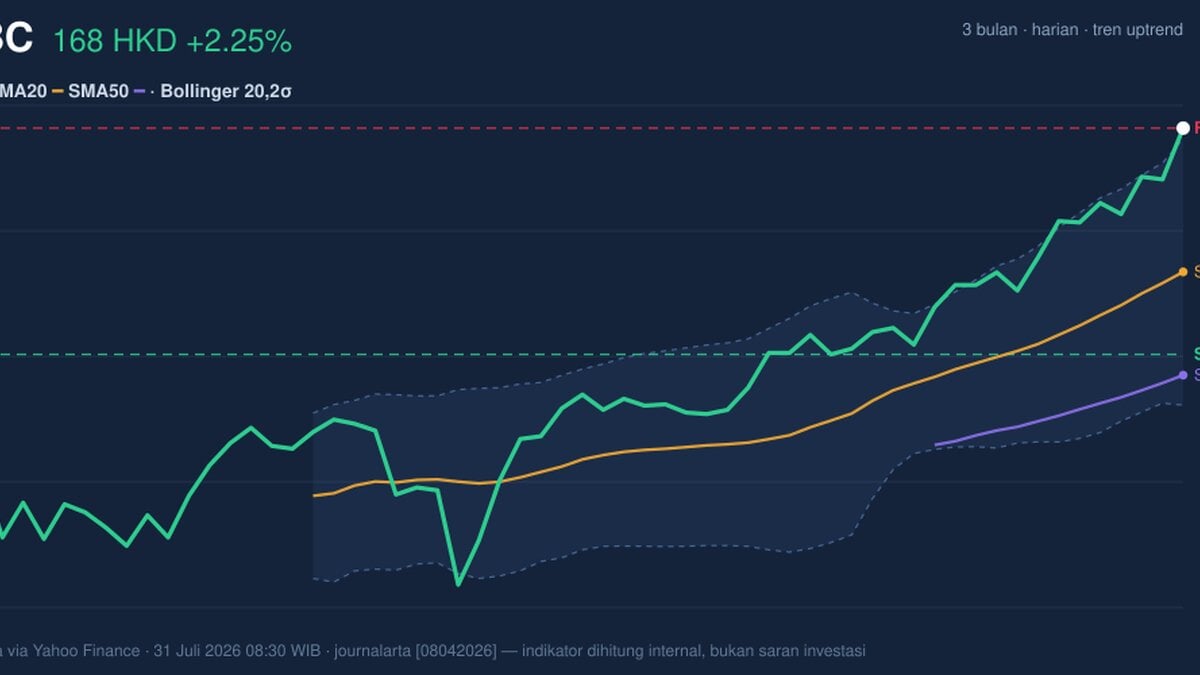
HSBC Holdings’ Hong Kong-listed shares closed at HKD 168.20, up from the previous close of HKD 164.50, and the move pushed the stock to the very top of its recent trading range. That matters because the latest print sits not just above the short-term trend line, but also above the upper Bollinger band at HKD 167.44, a sign that price has run ahead of its normal envelope rather than merely drifting higher inside it.
Trend & Price Action
The broader structure remains constructive. HSBC is trading above its SMA20 at HKD 157.84 and SMA50 at HKD 150.40, which keeps the medium-term trend pointed higher. The SMA20 slope of 2.52% over five days shows the short-term trend is still rising, and the stock’s 1-month gain of 10.66% confirms that the advance has been persistent rather than a one-day spike. There has been no fresh MA-cross, so the message from the moving averages is steady trend support rather than a new acceleration signal.
What is more striking is where price has landed within that trend. The stock is now at 100% of its 20-hour range, with 20-hour support at HKD 151.90 and resistance at HKD 168.20. In plain terms, the market has climbed to the ceiling of the recent range and is testing whether buyers can keep it there. The 3-month high at HKD 168.90 sits only slightly above the current price, so the next move is less about trend direction and more about whether the market can convert a near-high into a sustained breakout.
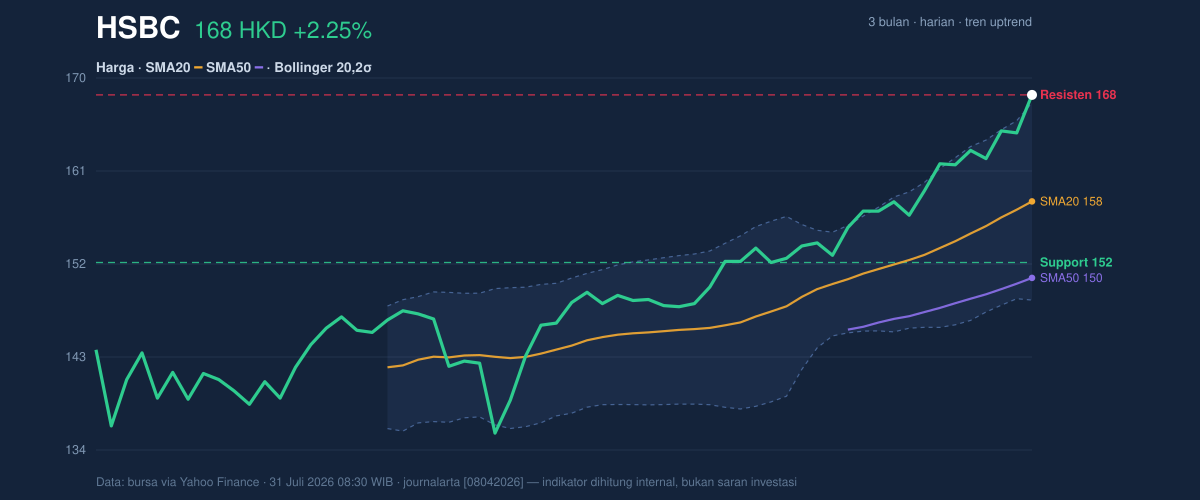
Price above both SMAs is still a bullish structure, but the stock is now pressing against resistance at HKD 168.20 and the upper Bollinger band at HKD 167.44, which often marks an area where momentum either extends forcefully or cools quickly. The chart shows that the recent advance is no longer cheap in technical terms; it is extended.
Oscillators & Momentum
The momentum gauges are strong, but also stretched. RSI(14) at 79.5 and Stochastic %K at 96.0 / %D at 98.2 both sit in overbought territory, meaning the stock has risen fast enough that short-term traders may already be crowded on the same side. Overbought does not automatically mean reversal, but it does mean the pace of gains has outstripped the market’s usual rhythm. That is especially important when the share price is already at the top of its range.
At the same time, the MACD at 4.469 remains above its signal line at 3.751, with a positive histogram of 0.718. That tells a different part of the story: upward momentum is still intact, and the trend has not yet lost its internal push. In other words, oscillators are not all saying the same thing. RSI and Stochastic warn that the move is stretched; MACD says the underlying trend still has fuel. That combination usually points to a market that is strong, but vulnerable to pauses or shallow pullbacks if buyers hesitate.
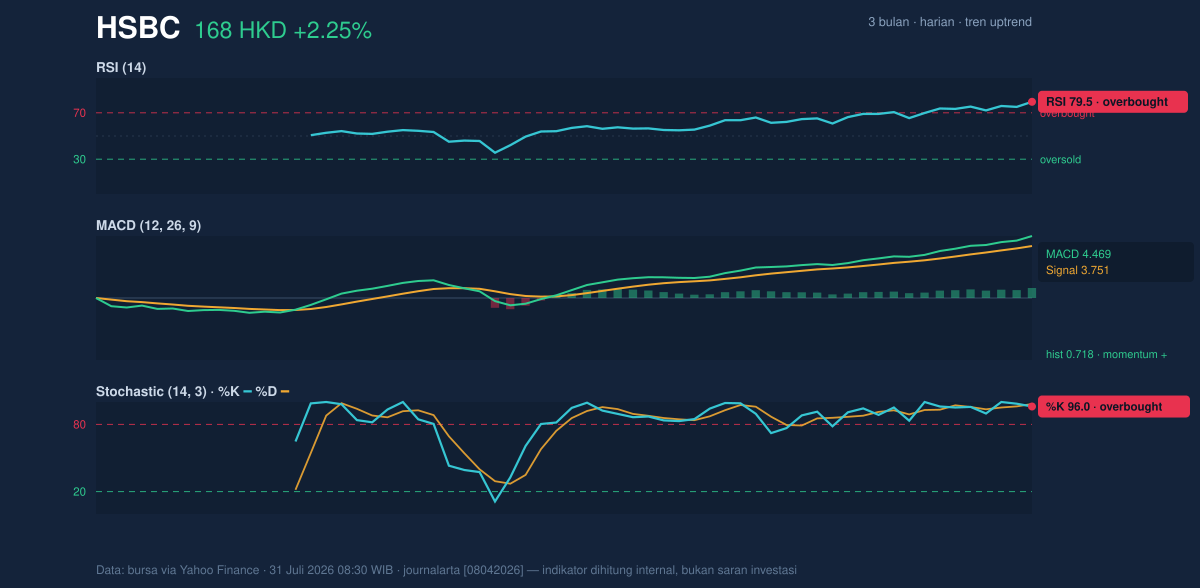
RSI is overbought, Stochastic is overbought, yet MACD remains positive — a classic sign of momentum that is still rising, but no longer comfortable. The chart suggests the stock is in a late-stage push within the current swing.
Volatility & Volume
Volatility is not flashing panic. ATR(14) at 2.90, or 1.7% of price, indicates moderate volatility: the stock is moving enough to matter, but not enough to imply disorder. Bollinger band width at 12.2% is described as normal, so this is not a squeeze setup waiting to explode from a compressed base. Instead, the interesting clue is that price is already above the upper band, with %B at 104%. That means the share price has moved beyond the band’s statistical boundary, often a sign of momentum extension rather than fresh consolidation.
Volume confirms participation. The latest turnover of 21,451,778 shares was about 1.6× the 20-hour average of 13,454,169, and OBV is rising. That combination matters because a breakout attempt without volume can be fragile; a breakout attempt with volume is harder to dismiss. Still, the market is now in the zone where strong participation can either validate a new leg higher or mark a crowded short-term top if follow-through stalls.
Volume is backing the move, but the stock is also extended beyond the upper Bollinger band, so the same participation that supports the trend can also amplify any near-term reversal.
Key Levels & Scenarios
The nearest technical reference points are clear. HKD 168.20 is now both the latest price and the immediate resistance marker, while HKD 167.44 is the upper Bollinger band that the stock has already exceeded. Above that, the next visible ceiling is the 3-month high at HKD 168.90. On the downside, the first meaningful cushion is the SMA20 at HKD 157.84, with deeper support at the 20-hour support of HKD 151.90 and the SMA50 at HKD 150.40.
If the share price can hold above the current resistance zone and push through the HKD 168.90 high, the chart would confirm continuation of the uptrend rather than just an overextended rally. If, instead, it slips back below the upper Bollinger band and then loses the SMA20, the message would shift from breakout attempt to trend digestion. The key signal to watch is whether the stock can remain above the band and the recent high without momentum flattening.
Technical Verdict: HOLD (wait & see)
HOLD (wait & see) is the clearest technical reading because the trend is still positive, but the stock is also stretched and sitting at a resistance cluster.
- MACD remains positive, showing trend momentum is still intact.
- RSI at 79.5 and Stochastic at 96.0 / 98.2 warn the move is overbought and vulnerable to pause.
- Price above the upper Bollinger band and at the top of the 20-hour range suggests extension rather than a fresh base.
Verdict invalidated if price breaks below HKD 157.84, the SMA20 that currently anchors the short-term trend.
- Ideal Entry Range: HKD 157.84 to HKD 151.90
- Exit Target (Target Price): HKD 168.90
- Stop Loss protection: below HKD 150.40
In plain English: the chart still points up, but the stock is already running hot, so the next move matters more than the last one.
OBV is rising, and the latest volume print was 21,451,778 shares.
Summary Data HSBC
| Last price | 168.20 HKD |
| Change 1 day / 5 days / 1 month | 2.25% / 4.21% / 10.66% |
| Trend / MA-cross | uptrend / none |
| SMA20 / SMA50 | 157.84 / 150.40 |
| RSI (14) / Stochastic %K | 79.5 / 96.0 |
| Bollinger %B / ATR | 104% / 2.90 |
| Support / Resistance 20 days | 151.90 / 168.20 |
| Data as of | 31 Juli 2026 08:30 WIB |
Track HSBC share price daily: live levels, support/resistance and our full HSBC analysis history.