Momentum Weakens, UOB Stock Drops 1.91% Today
On Agustus 4, 2026: price 43.04 SGD, trend sideways, RSI 59.6, support 40.52, resistance 44.95. technical analysis of uob stock. Momentum Weakens — full…
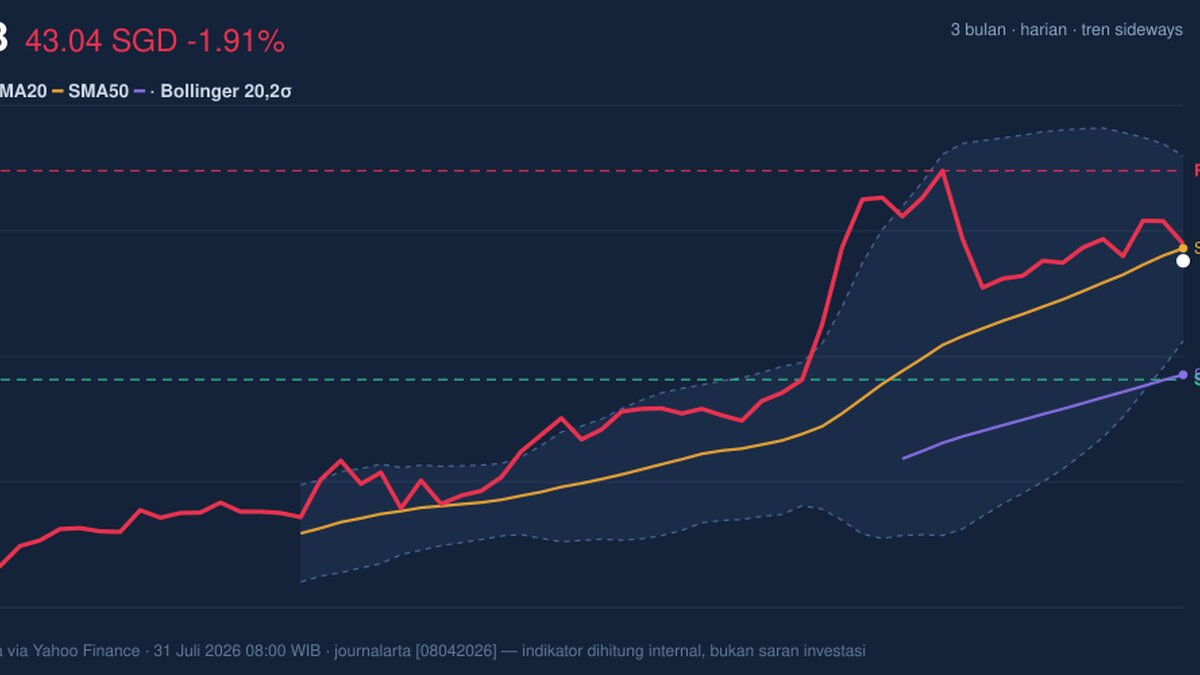
United Overseas Bank’s U11.SI shares in Singapore slipped to 43.04 SGD on 31 July 2026, down from 43.88 the previous close, as the stock drifted back after a modest one-month gain of 6.96%. The move matters less as a single-day drop than as a test of whether UOB can stay above its short-term trend line: the shares are now below the SMA20 at 43.30, even though the longer SMA50 at 40.62 still sits well underneath. That combination usually signals a market that is not in outright breakdown mode, but is losing some of the near-term upward push that had carried it higher in recent weeks.
Trend & Price Action
As shown in the chart, UOB remains in a sideways trend, with the SMA20 still rising at 2.15% over five days, which means the short-term average is climbing even if the latest price is not keeping pace. That is an important distinction: a rising moving average with price just under it often points to consolidation rather than trend failure, but it also shows buyers are no longer dominating every session. The stock is trading in the upper half of its recent range, at 57% of the 20-hour range, which suggests it has not been pushed into the weak end of its band despite the decline.
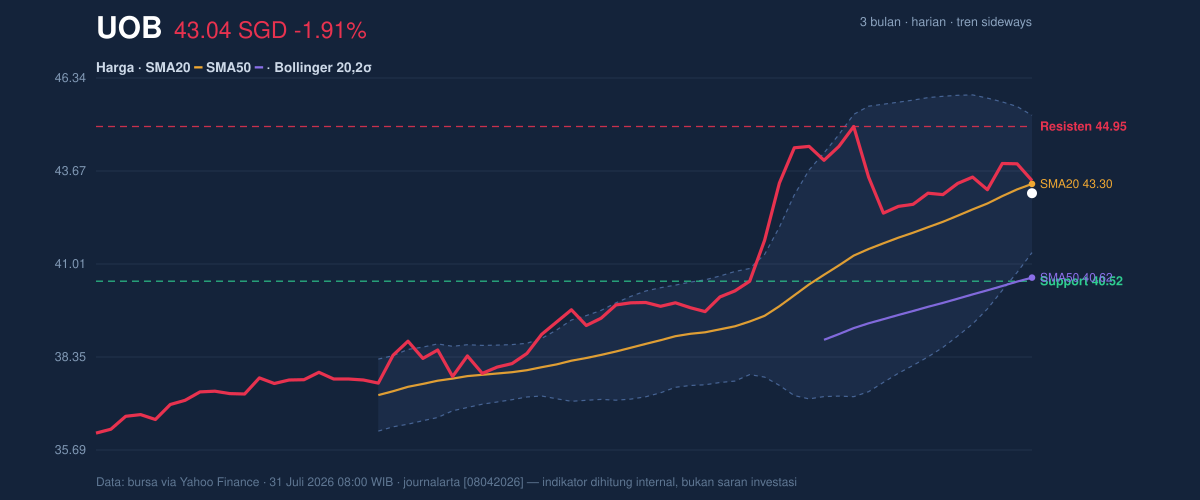
The broader range gives the move more context. UOB’s three-month high is 45.15 and the three-month low is 36.01, so the current level sits closer to the top of that span than the bottom. That positioning usually reflects a market that has already repriced some optimism, but is now pausing to decide whether earnings strength, rates, or sector sentiment can justify another attempt higher. The nearby 20-hour support at 40.52 and resistance at 44.95 frame the immediate battle: the stock is not far from resistance, but not comfortably above the short-term average either.
Oscillators & Momentum
The momentum picture is mixed, and that is the key signal in the chart. The RSI at 59.6 is still neutral, which means the stock is neither stretched nor washed out, while the Stochastic at 47.1 versus 56.9 also sits in neutral territory. In plain language, neither oscillator is screaming that the move is overdone. That matters because neutral oscillators leave room for either direction; they do not force a reversal, but they also do not strongly endorse an immediate breakout.
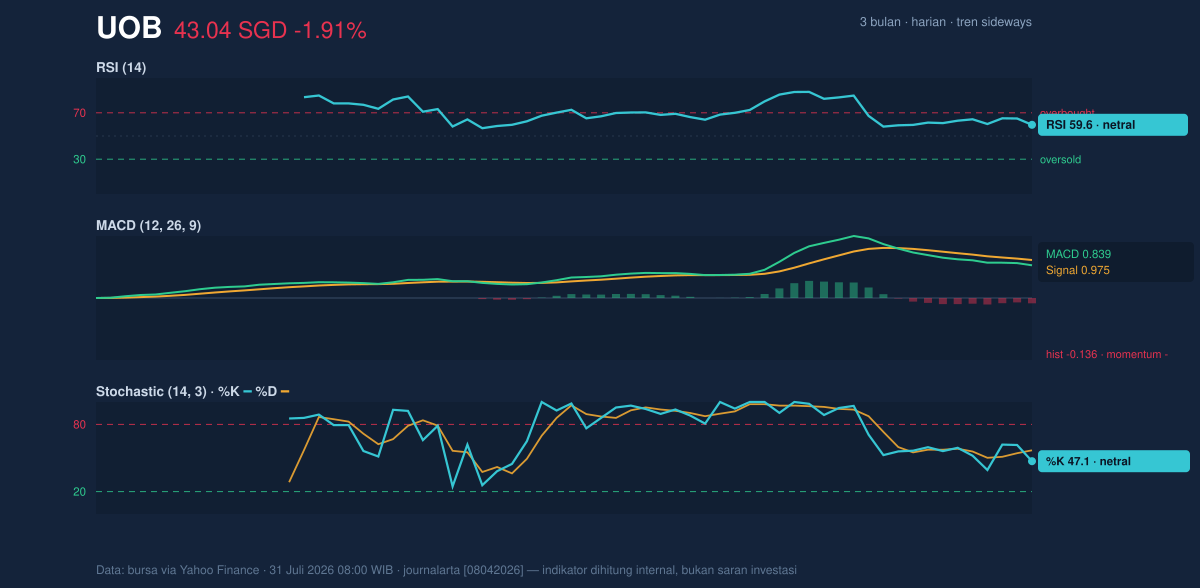
The more cautionary read comes from the MACD at 0.839, below its signal line at 0.975, with a histogram of -0.136. MACD measures whether short-term momentum is outrunning the longer-term trend, and a negative histogram means that edge has faded for now. This does not automatically mean a larger decline is coming, but it does say the recent lift has lost some traction. When MACD turns negative while RSI and Stochastic remain neutral, the message is usually one of hesitation: the trend is not broken, but the market is not rewarding buyers with strong follow-through.
Volatility & Volume
Volatility is contained rather than explosive. The Bollinger Band width of 9.1% is described as normal, and the %B at 43% puts price below the middle of the band, leaning toward the lower half without approaching oversold extremes. That setup often indicates a stock that is drifting inside an established corridor, with room to move either way once a catalyst appears. The ATR(14) at 0.90, equal to about 2.1% of price, reinforces that view: daily swings are present, but not unusually wide.
Volume offers a mild positive counterweight. Last trade volume of 3,958,200 was about 1.1× normal versus the 20-day average of 3,667,188, and OBV is rising. OBV, or on-balance volume, tracks whether money is broadly flowing into or out of a stock. A rising OBV during a soft price patch suggests buyers have not disappeared; they may simply be waiting for a better entry point or clearer confirmation. That is why the price slip looks more like a pause than a full sentiment reversal.
Key Levels & Scenarios
The immediate technical map is straightforward. Support at 40.52 is the first level that would matter if the stock loses its footing, while 43.30 — the SMA20 — is now acting as a short-term pivot. On the upside, 44.95 is the nearest resistance, and a push through that zone would bring the 45.15 three-month high back into view. Because price is currently below the SMA20 but above the SMA50, the chart is signaling a market caught between short-term caution and longer-term stability.
If UOB reclaims and holds above 43.30, the setup improves because it would show the stock has recovered its short-term average and may be ready to retest 44.95. If it fails to hold the low-40s area, the next meaningful concern is whether 40.52 can absorb selling pressure. A break below that support would shift the story from consolidation to a more defensive phase.
Technical Verdict: HOLD (wait & see)
HOLD (wait & see) — the stock is not weak enough for a bearish call, but the loss of the SMA20 and the negative MACD histogram argue against treating the latest move as a clean continuation.
- Reason 1: Price is below the SMA20 at 43.30, which shows short-term momentum has softened.
- Reason 2: MACD is negative with the histogram at -0.136, confirming fading near-term momentum.
- Reason 3: RSI at 59.6 and Stochastic at 47.1 / 56.9 remain neutral, so the chart is not oversold and does not yet offer a strong reversal signal.
- Invalidation: the verdict is invalidated if price falls below 40.52.
- Ideal Entry Range: 40.52 to 43.30
- Exit Target: 44.95 to 45.15
- Stop Loss protection: below 40.52
In plain English, UOB is still holding its broader structure, but the next move needs confirmation before the chart stops looking like a pause and starts looking like a fresh advance.
Summary Data UOB
| Last price | 43.04 SGD |
| Change 1 day / 5 days / 1 month | -1.91% / -0.65% / 6.96% |
| Trend / MA-cross | sideways / none |
| SMA20 / SMA50 | 43.30 / 40.62 |
| RSI (14) / Stochastic %K | 59.6 / 47.1 |
| Bollinger %B / ATR | 43% / 0.90 |
| Support / Resistance 20 days | 40.52 / 44.95 |
| Data as of | 31 Juli 2026 08:00 WIB |
Track UOB share price daily: live levels, support/resistance and our full UOB analysis history.