OCBC Stock Drops 0.79% Today, Momentum Weakens
On Agustus 4, 2026: price 28.87 SGD, trend uptrend, RSI 67.6, support 25.49, resistance 29.78. technical analysis of ocbc stock. OCBC Stock Drops — full…
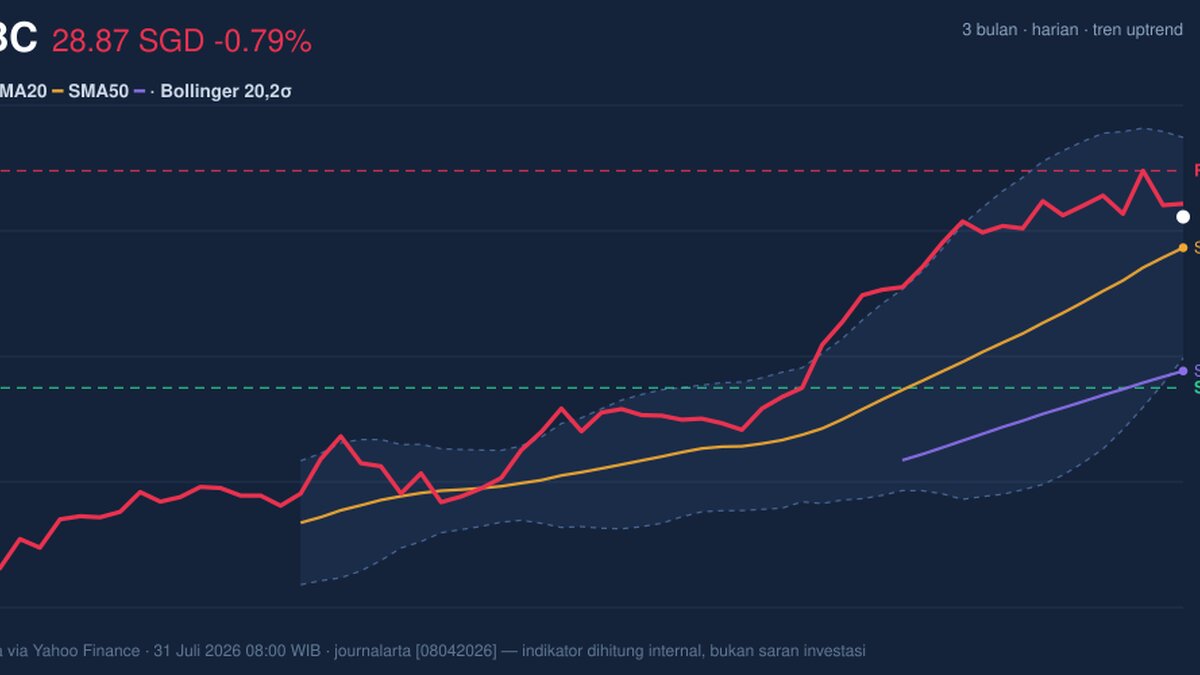
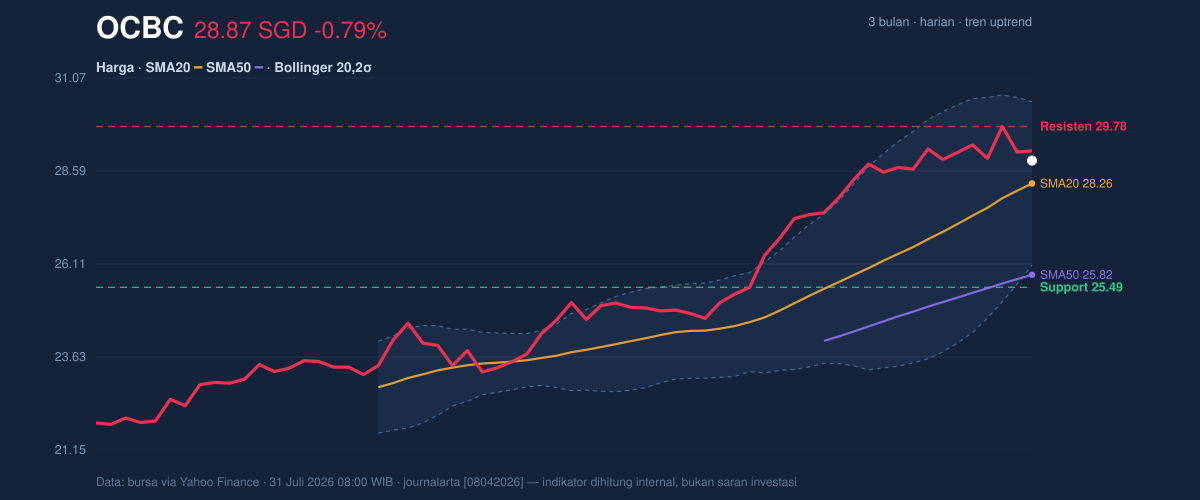
OCBC Bank slipped 0.79% to SGD 28.87 on 31 July, but the pullback sits inside a broader advance rather than a trend break. The stock remains in an uptrend, trading above its SMA20 at 28.26 and far above its SMA50 at 25.82, while the 20-day moving average is still rising at 3.96% over five days. That combination matters: it shows the medium-term trend is still pointing higher even after a modest one-day fade, and it also explains why the market has not treated the latest dip as a structural reversal.
Trend & Price Action
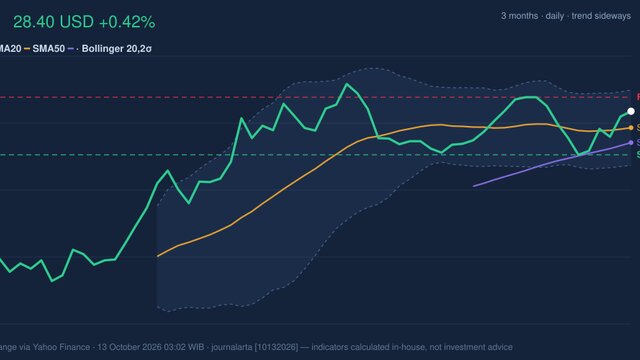
As shown in the chart, OCBC is holding in the upper part of its recent range, with the last price sitting at about 79% of the 20-hour range between SGD 25.49 support and SGD 29.78 resistance. That placement signals that buyers have kept control of the broader swing, even though the stock is now only a little below the three-month peak of SGD 29.78. The lack of a fresh moving-average crossover is also important. It suggests the trend’s strength is coming from price staying above key averages, not from a newly triggered technical acceleration, which often leaves room for consolidation before the next directional move.
The Bollinger Band structure reinforces that reading. Price is above the middle band at 28.26 and below the upper band at 30.44, with %B at 64% and band width at 15.4%, described as normal. In plain language, OCBC is not stretched into an extreme zone, but it is also not compressed in a way that usually precedes a sharp breakout. That means the market is still digesting gains rather than signaling a dramatic expansion in either direction.
Oscillators & Momentum
The momentum picture is more mixed than the trend picture. The RSI at 67.6 is labeled neutral, but it sits close to the upper end of the range where rallies can start to lose pace. The Stochastic %K at 75.1 and %D at 83.0 are also neutral, yet they show the short-term move has been strong enough to keep the oscillator elevated. That usually means the stock is still being bought on dips, but fresh upside may need a pause or a better catalyst.
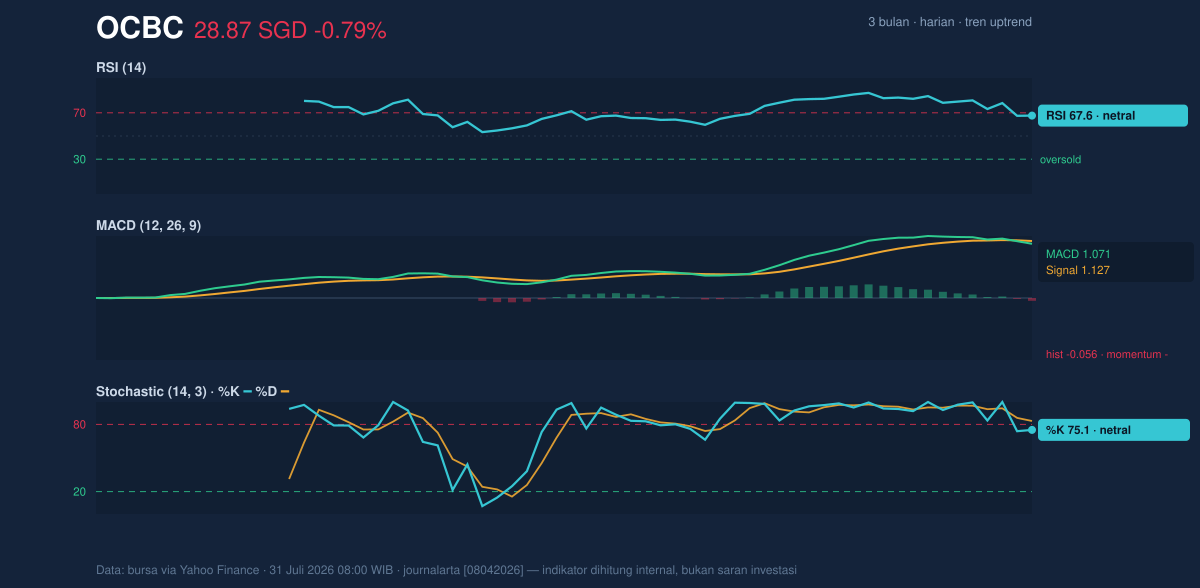
The clearest warning comes from MACD. The MACD at 1.071 remains above zero, which is consistent with an uptrend, but it is now below the signal line at 1.127, leaving a -0.056 histogram. That negative histogram is a small but meaningful sign that upside momentum has softened. It does not by itself negate the trend, yet it does say the latest push higher has cooled enough for traders to test whether buyers still have conviction near resistance.
Volatility & Volume
Volatility is present but not excessive. The ATR(14) at 0.61, or 2.1% of price, points to moderate daily movement rather than a disorderly swing regime. That matters because a stock near its range high can still move decisively, but the current ATR suggests any break above resistance may be gradual rather than explosive.
Volume offers a useful confirmation. Last turnover of 7,061,400 shares was modestly above the 20-day average of 6,717,195, or about 1.1× normal. That is not a surge, but it is enough to show the latest trading day was not marked by abandonment. More importantly, OBV is rising, which means cumulative volume has been supporting the price trend. When OBV climbs while price holds near highs, it usually indicates that more shares are changing hands on up days than on down days, a constructive sign for trend durability.
Key Levels & Scenarios
The immediate technical map remains straightforward. SGD 29.78 is the first resistance to watch, and it is also the stock’s 3-month high. A clean move through that zone would suggest the market is willing to extend the existing uptrend rather than simply orbit the top of the range. On the downside, SGD 28.26 is the first important pivot because it is the SMA20 and the Bollinger middle band; a loss of that level would imply momentum is fading faster than price alone suggests. Below that, SGD 26.08 marks the lower Bollinger band, while SGD 25.49 is the broader 20-hour support area. A break of the latter would be a stronger sign that the recent advance is losing its base.
Technical Verdict: HOLD (wait & see)
The technical setup argues for HOLD (wait & see) rather than an aggressive directional stance.
- Uptrend remains intact: price is above the SMA20 at 28.26 and well above the SMA50 at 25.82.
- Momentum is cooling: MACD is below its signal line and the histogram is negative, which often precedes consolidation.
- Price is near resistance: the stock is trading close to SGD 29.78, the recent high and key ceiling.
- Verdict invalidated if price breaks below SGD 28.26, as that would mean the stock has lost its short-term trend anchor.
- Ideal entry range: SGD 28.26 to SGD 28.87
- Exit target: SGD 29.78
- Stop loss protection: SGD 26.08
In plain English, OCBC still looks technically healthy, but the chart is asking for confirmation before the next leg higher. The next market cue will be whether price can clear SGD 29.78 or first retest SGD 28.26 after the latest close.
Summary Data OCBC
| Last price | 28.87 SGD |
| Change 1 day / 5 days / 1 month | -0.79% / -0.76% / 14.07% |
| Trend / MA-cross | uptrend / none |
| SMA20 / SMA50 | 28.26 / 25.82 |
| RSI (14) / Stochastic %K | 67.6 / 75.1 |
| Bollinger %B / ATR | 64% / 0.61 |
| Support / Resistance 20 days | 25.49 / 29.78 |
| Data as of | 31 Juli 2026 08:00 WIB |
Track OCBC share price daily: live levels, support/resistance and our full OCBC analysis history.