Shell Stock Analysis: Gains 2.61%, Golden Cross Formed
On Agustus 4, 2026: price 3,405.50 GBp, trend uptrend, RSI 67.6, support 2,912.50, resistance 3,383.50. technical analysis of shell stock.
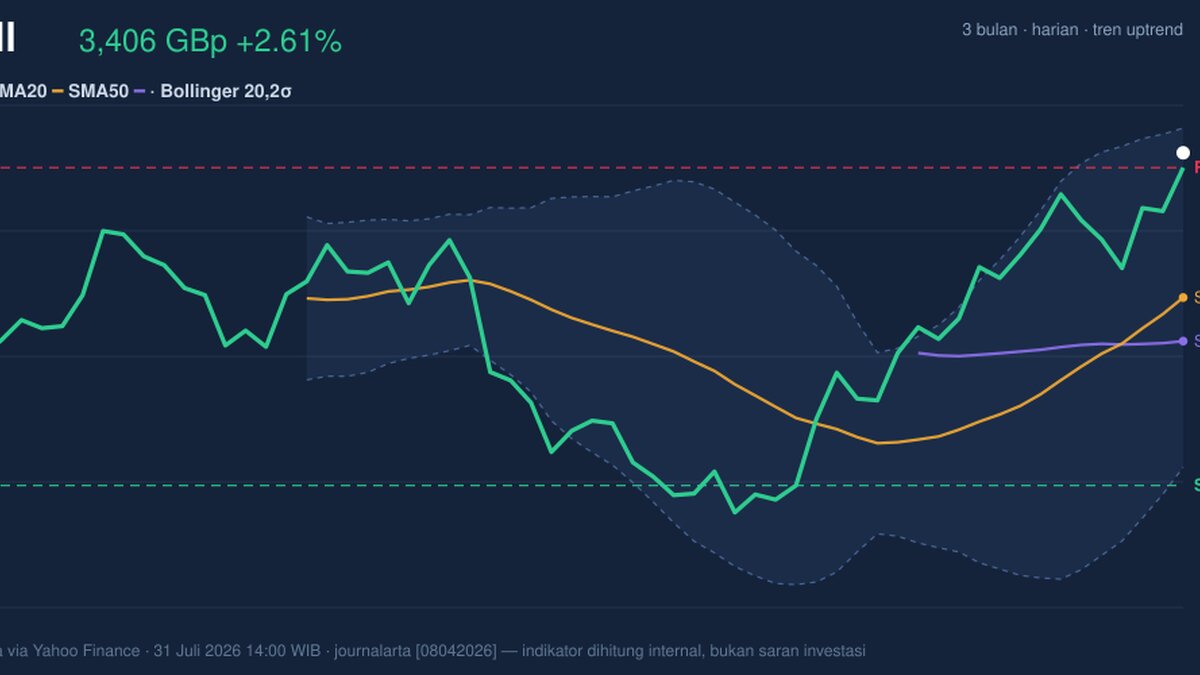
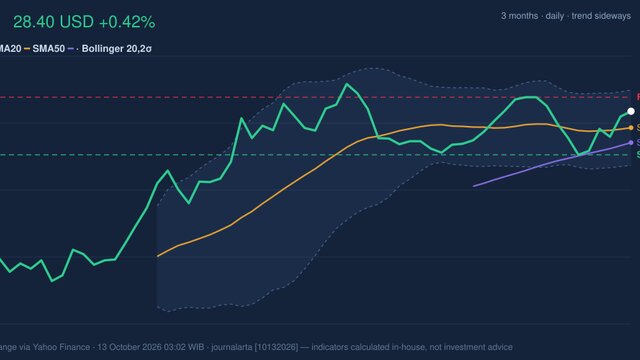
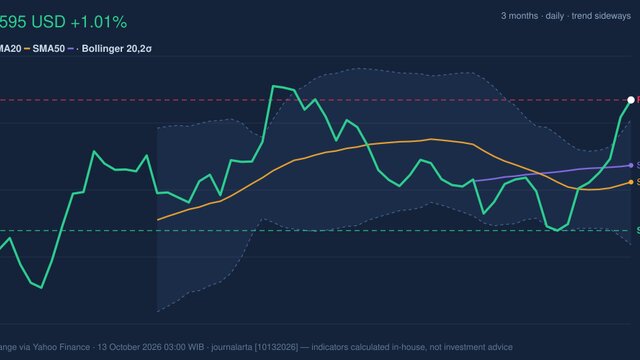
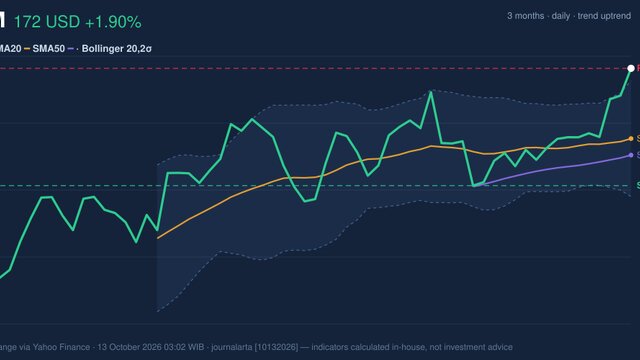
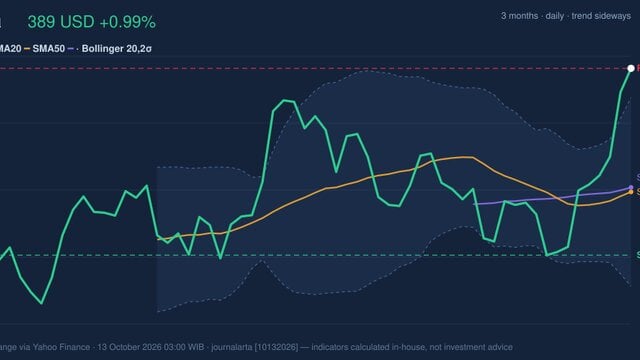
Shell plc climbed on the London Stock Exchange on 31 July 2026, with the shares last changing hands at 3,405.50 GBp, up 2.61% on the day and extending a 17.78% gain over one month, according to market data via Yahoo Finance. The move matters because it is not just a bounce off a quiet session: Shell is now trading above both short- and medium-term trend markers, while momentum indicators show the rally is still alive but increasingly stretched, as shown in the chart.
Trend & Price Action
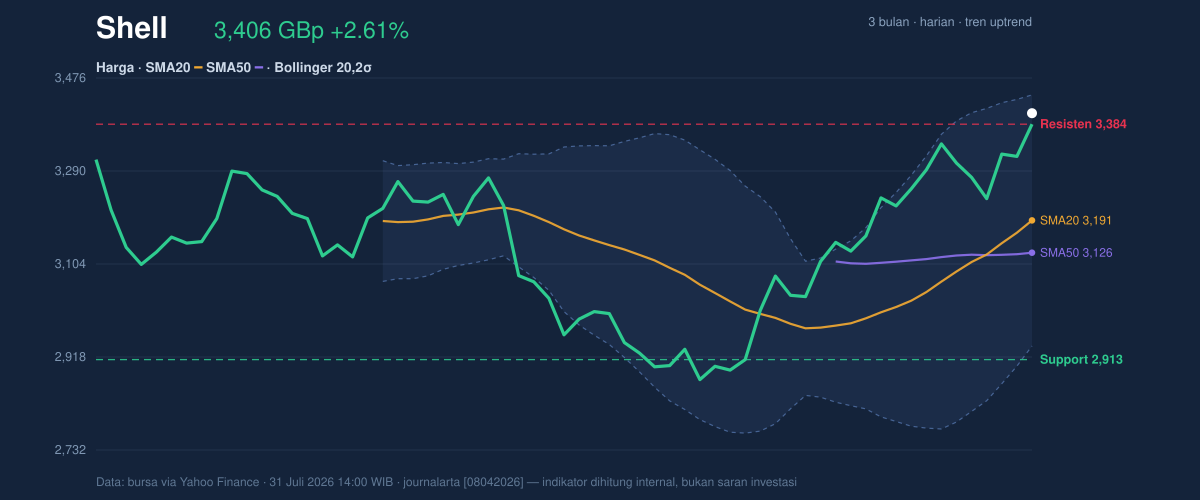
Shell’s price sits above SMA20 at 3,190.85 and SMA50 at 3,126.25, with the shorter average still rising at a 3.30% five-day slope. That combination is the textbook shape of an uptrend: the market is paying up for recent strength, and the faster average remains well above the slower one after a golden cross, meaning the near-term trend has overtaken the longer one.
The signal is constructive, but not carefree. At 3,405.50 GBp, Shell is also trading near the upper edge of its Bollinger band at 3,442.00, and the price is at 105% of the stated 20-hour range. In plain language, the shares are no longer sitting in the middle of the move; they are pressing toward the top of the recent structure, where advances often become more vulnerable to pauses or pullbacks.
The broader range still leaves room above and below. The 3-month high is 3,758.50 and the 3-month low is 2,559.50, so the stock has recovered strongly from the lower part of that band without yet revisiting the peak. That positioning suggests the market has repaired some of the damage from earlier weakness, but the next leg will need fresh demand rather than just trend-following inertia.
Oscillators & Momentum
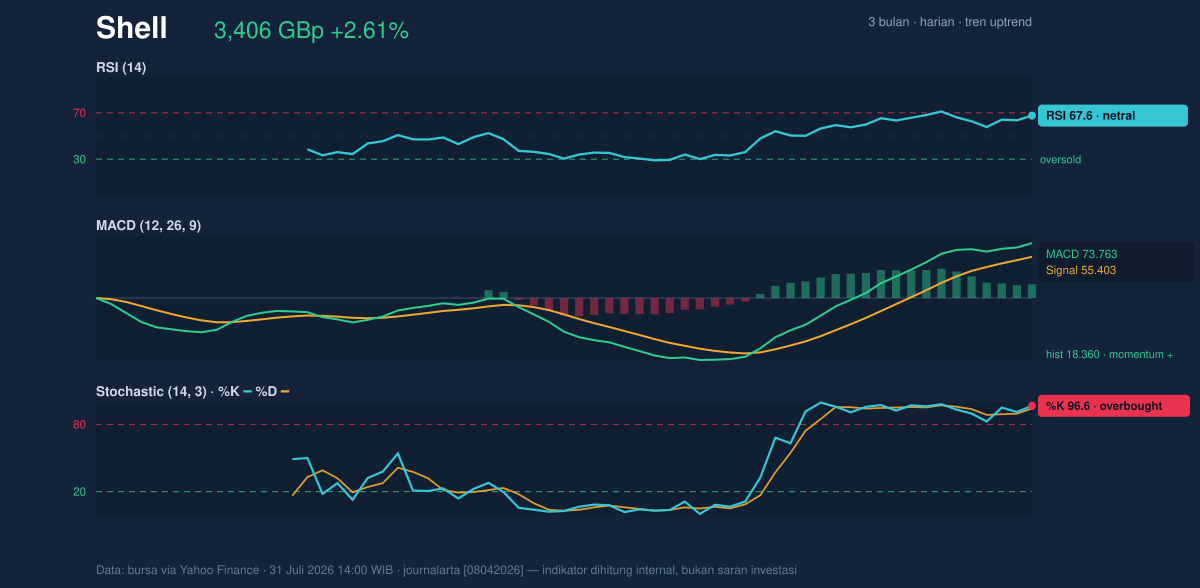
Momentum is mixed in a way that often appears late in an advance. The RSI at 67.6 is still described as neutral in the data, but it is close to the usual overbought area, which tells readers the rally has gained pace without yet fully exhausting itself. More importantly, the Stochastic %K at 96.6 and %D at 94.2 are both overbought, a sign that the latest price gains have moved faster than the market’s recent average rhythm.
That does not automatically mean reversal. It means the stock is extended and more sensitive to any disappointment. The MACD at 73.763, above its signal line at 55.403 with a positive histogram of 18.360, still confirms upward momentum. In practical terms, the trend engine is still running, but oscillators are warning that the speed of the move has outpaced the comfort zone.
This is where the chart matters. As shown in the momentum panel, the MACD is not diverging against price; it is still supporting it. Yet the Stochastic sitting deep in overbought territory often means the stock may need to consolidate before it can push much higher with conviction.
Volatility & Volume
Volatility is present, but not explosive. ATR(14) at 103.93, or 3.1% of price, points to moderate volatility: the shares can move meaningfully in a session, but not in a disorderly way. The Bollinger band width of 15.7% is also described as normal, which suggests the move has not yet entered a panic or squeeze regime. In other words, the tape is active, but not unusually chaotic.
Volume offers a more cautious note. The latest turnover of 8,122,577 was below the 20-day average of 9,000,314, or 0.9x normal. That matters because rallies built on lighter participation can be more fragile than rallies backed by broad trading. The good news is that OBV is rising, meaning cumulative volume is still leaning in the direction of the advance; buyers remain present even if the latest session was not a heavy-volume breakout.
Key Levels & Scenarios
The chart shows a clear near-term battleground around the recent resistance zone. Resistance at 3,383.50 has already been surpassed, which turns that area into a first line of support if the shares retrace. Below that, SMA20 at 3,190.85 is the more important trend reference, because it marks the average price of the recent move and often acts as a magnet during pullbacks. The deeper cushion is support at 2,912.50, which would matter if the rally loses its structure.
If Shell holds above the former resistance band, the market can keep testing the upper Bollinger area near 3,442.00. If it slips back under 3,383.50 and then fails to defend 3,190.85, the message changes from trend continuation to consolidation, with the risk that momentum has peaked for now.
Technical Verdict: HOLD (wait & see)
HOLD (wait & see)
- Reason 1: The trend is positive, with price above SMA20 and SMA50 and a confirmed golden cross.
- Reason 2: MACD remains supportive, showing momentum is still positive.
- Reason 3: Stochastic is overbought and price is near the upper Bollinger band, so the move looks extended rather than cleanly fresh.
- Verdict invalidated if price falls below 3,190.85, because that would mean the short-term trend base has failed.
- Ideal Entry Range: 3,190.85 to 3,383.50
- Exit Target: 3,442.00
- Stop Loss protection: 2,912.50
For non-traders, this means Shell still looks strong, but the shares are close enough to stretched territory that the market may want a pause before deciding on the next move.
“The market is still rewarding Shell’s trend, but it is now asking whether buyers have enough conviction left to keep paying higher prices.”
Summary Data Shell
| Last price | 3,405.50 GBp |
| Change 1 day / 5 days / 1 month | 2.61% / 3.03% / 17.78% |
| Trend / MA-cross | uptrend / golden |
| SMA20 / SMA50 | 3,190.85 / 3,126.25 |
| RSI (14) / Stochastic %K | 67.6 / 96.6 |
| Bollinger %B / ATR | 93% / 103.93 |
| Support / Resistance 20 days | 2,912.50 / 3,383.50 |
| Data as of | 31 Juli 2026 14:00 WIB |
Track Shell share price daily: live levels, support/resistance and our full Shell analysis history.