Testing Key Resistance, Tencent Stock Gains 3.94% Today
On Agustus 4, 2026: price 490.40 HKD, trend uptrend, RSI 57.1, support 434.60, resistance 484.00. technical analysis of tencent stock. Testing Key Resistance —…
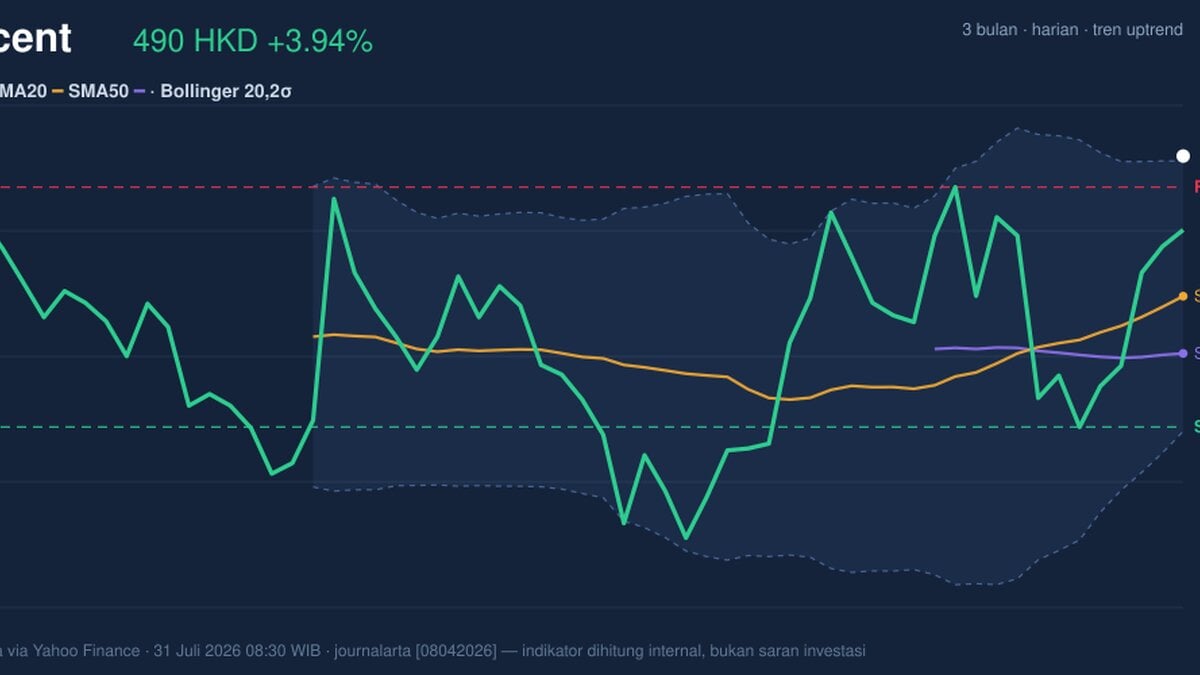
Tencent Holdings advanced on the Hong Kong stock exchange on 31 July 2026, with 0700.HK last at 490.40 HKD, up 3.94% on the day and pressing into the upper edge of its recent range, according to data from Yahoo Finance via the exchange feed. The move matters because it was not a random spike: price is now above the 20-day and 50-day moving averages, the trend is still pointed higher, and the stock is trading just beyond the upper Bollinger band. In plain terms, Tencent is no longer merely recovering — it is testing how much momentum the current advance can sustain.
Trend & Price Action
The chart shows a market that remains technically constructive. Tencent’s price at 490.40 HKD sits above SMA20 at 461.55 and SMA50 at 449.76, which tells traders the shorter-term trend is still leading the medium-term trend higher. The SMA20 slope of 1.99% over 5 days reinforces that the average price itself is rising, a sign that recent strength is being absorbed into the broader trend rather than fading after a one-day burst.
There is no fresh moving-average crossover to point to, which is important: this is not a new trend ignition story, but a continuation story. The signal is steadier, less dramatic. Price is also sitting at 113% of the 20-hour range, above the 20-hour resistance at 484.00 and only slightly below the 3-month high of 494.80. That places Tencent near the top of its recent trading envelope, where the market often pauses to decide whether the breakout is real or just extended.
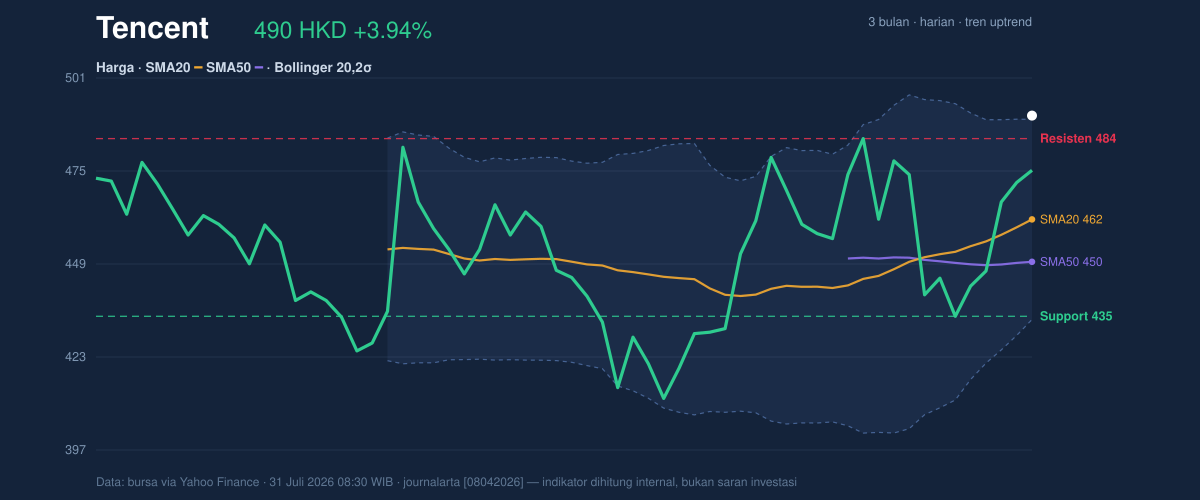
The immediate message from the price structure is simple: the stock is strong, but it is now close to a ceiling that has not yet been decisively cleared.
Oscillators & Momentum
The momentum picture is supportive, though not overheated enough to call it stretched in a dangerous way. RSI at 57.1 sits in neutral territory, which means the stock is not flashing the kind of overbought reading that usually warns of an imminent snapback. At the same time, it is comfortably above the weak-zone levels that would imply fading demand. Stochastic %K at 68.8 and %D at 62.3 also read as neutral-to-firm, showing price is near the upper end of its recent band without yet entering a classic exhaustion zone.
The more decisive signal comes from MACD. MACD at 3.590 is above its signal line at 2.471, with a positive histogram of 1.119. For general readers, that means the recent pace of gains is still outrunning the slower trend measure — a common sign that buyers remain in control. It does not guarantee continuation, but it does show the rally is still being confirmed by momentum rather than solely by price chasing.
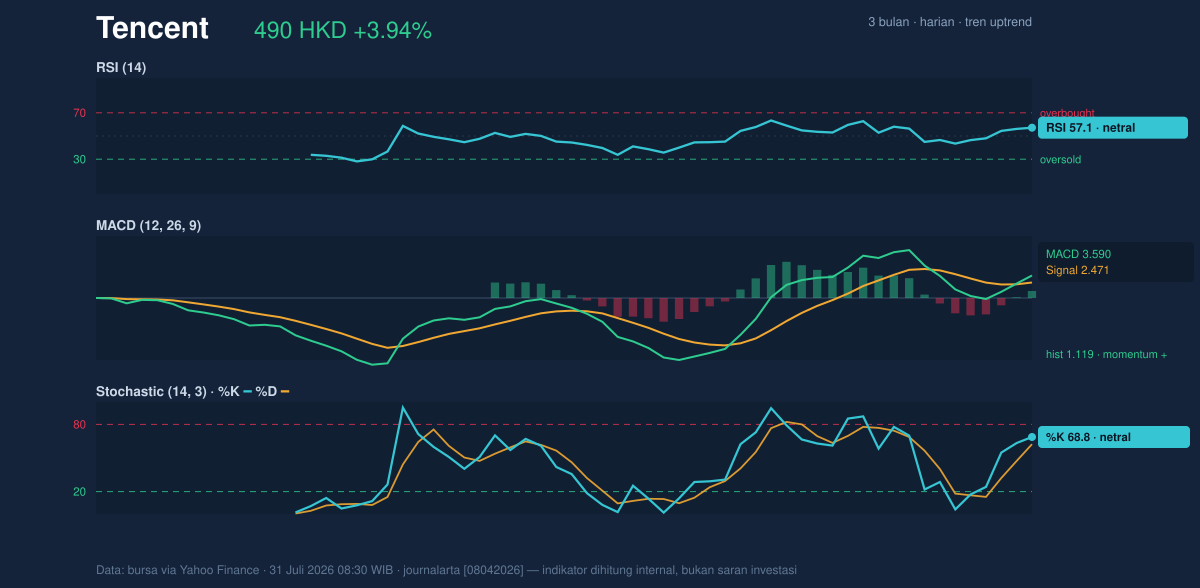
What stands out is the balance: momentum is positive, but not euphoric. That is often the healthiest setup for a trend that wants to keep going.
Volatility & Volume
Bollinger bands help show where price sits relative to its recent statistical range. Tencent’s upper band at 489.39 is now just below the last price, while the middle band at 461.55 lines up exactly with SMA20. The %B reading of 102% means price has pushed slightly beyond the upper band, which often signals strength, but also warns that the stock may be running ahead of its average pace. The 12.1% band width is normal, not compressed, so this is not a volatility squeeze waiting to explode; it is already an active market.
The ATR(14) of 17.66, equal to 3.6% of price, says daily swings remain relatively large. That matters because a stock trading near resistance with elevated ATR can move quickly in either direction once it chooses a path. Volume adds a more cautious note: 31,100,240 shares traded versus a 20-hour average of 34,742,577, or 0.9× normal. So the price advance is happening without an obvious surge in participation. That is not bearish by itself — especially with OBV rising, which indicates net accumulation over time — but it does suggest the breakout attempt is not yet backed by full conviction from the market.
The signal here is mixed but important: price is strong, participation is adequate, and the next move likely needs a cleaner volume response to extend.
Key Levels & Scenarios
The nearest technical battlefield is clear. Resistance at 484.00 has already been exceeded intraday, and the stock is now challenging the 3-month high at 494.80. A sustained move through that zone would shift attention away from range resistance and toward trend continuation. On the downside, support at 434.60 is the first meaningful floor, sitting above the lower Bollinger band at 433.71. That alignment matters because it is where trend traders would expect buyers to defend the structure if momentum cools.
If price holds above the recent breakout area, the chart suggests Tencent may continue to work higher within its existing uptrend. If it fails to hold above the resistance band and slips back under the 20-day average, the signal would weaken materially, because the market would be showing that it can push through the top of the range but not stay there.
The core issue is whether Tencent can convert a stretched-but-healthy advance into a durable breakout, or whether it is simply pausing at the top of its range.
Technical Verdict: HOLD (wait & see)
HOLD (wait & see)
- MACD remains positive with the line above signal and a positive histogram, supporting the trend.
- Price is above SMA20 and SMA50, and the SMA20 slope is rising, confirming the broader uptrend.
- %B at 102% shows price is already pressing beyond the upper Bollinger band, while volume is only 0.9× normal, so confirmation is not yet ideal.
- Verdict invalidated if price falls below 434.60 HKD, which would break first support and weaken the current structure.
- Ideal Entry Range: 484.00 HKD to 489.39 HKD, on evidence that the breakout zone is holding.
- Exit Target: 494.80 HKD, the 3-month high and immediate upside reference.
- Stop Loss protection: 434.60 HKD, below support and near the lower Bollinger band.
In plain English: Tencent looks strong, but the chart is asking for proof that the move can stay above resistance before the next leg is trusted.
"Right now the market is saying, ‘show me you can hold it.’"
Summary Data Tencent
| Last price | 490.40 HKD |
| Change 1 day / 5 days / 1 month | 3.94% / 12.84% / 13.73% |
| Trend / MA-cross | uptrend / none |
| SMA20 / SMA50 | 461.55 / 449.76 |
| RSI (14) / Stochastic %K | 57.1 / 68.8 |
| Bollinger %B / ATR | 102% / 17.66 |
| Support / Resistance 20 days | 434.60 / 484.00 |
| Data as of | 31 Juli 2026 08:30 WIB |
Track Tencent share price daily: live levels, support/resistance and our full Tencent analysis history.