Alibaba Stock Technicals Today: Drops 0.48%, Golden Cross Formed
On Agustus 10, 2026: price 123.80 HKD, trend uptrend, RSI 61.5, support 110.00, resistance 128.10. technical analysis of alibaba stock.

Alibaba Group’s Hong Kong-listed shares ended at HK$123.80 on 7 August 2026, down 0.48% on the day, even as the stock remained firmly above its short- and medium-term trend lines, according to data from the exchange via Yahoo Finance. The move matters less as a one-day slip than as a test of how much of the recent rally is still being carried by momentum rather than fresh trading participation: the share price is still in an uptrend, but the latest session came with light volume, which means the advance is not being reinforced by broad turnover in the way a stronger breakout usually would be.
Trend & Price Action
The structure on the chart shows a stock that is still technically constructive. Alibaba is trading above the SMA20 at HK$116.47 and above the SMA50 at HK$111.42, while the golden cross — where the faster 20-day average rises above the 50-day average — signals that shorter-term price strength has overtaken the slower trend. In plain terms, that crossover often tells market participants that buyers have been in control long enough to shift the trend framework, not just produce a brief bounce.
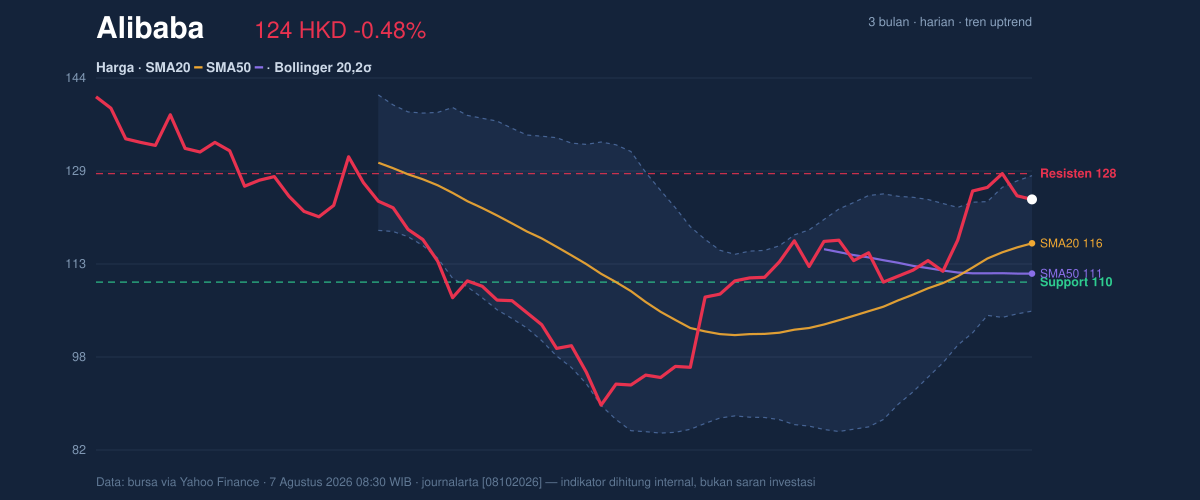
The price is also sitting near the upper half of its recent trading band, with HK$128.10 acting as the nearest resistance and HK$110.00 as the first support. At 76% of the range, the stock is closer to the top than the bottom, which usually means the market is asking whether the rally has enough fuel to keep pushing into resistance or whether it needs to cool off first. That tension is visible in the Bollinger Bands: price is near the upper band at HK$127.77, but not yet outside it, suggesting strength without a confirmed extension.
The broader backdrop is still favorable. Over 5 days the stock has gained 5.81%, and over 1 month it is up 12.34%. The chart is not showing a broken pattern; it is showing a rally that has already done a fair amount of work.
Oscillators & Momentum
Momentum indicators are supportive, but not euphoric. The RSI at 61.5 sits in neutral territory, which means the stock is not overbought even after the recent run. That is important: a neutral RSI in an uptrend often implies the market still has room before momentum becomes stretched. The Stochastic oscillator is also in neutral territory, with %K at 74.3 and %D at 82.1; because %K remains below %D, the short-term pace has eased a bit, hinting that the stock may be pausing rather than accelerating. The MACD remains positive, with 4.017 above its signal line at 2.621 and a positive histogram of 1.396. That combination means the trend is still being confirmed by underlying momentum, even if the latest price move was modest.
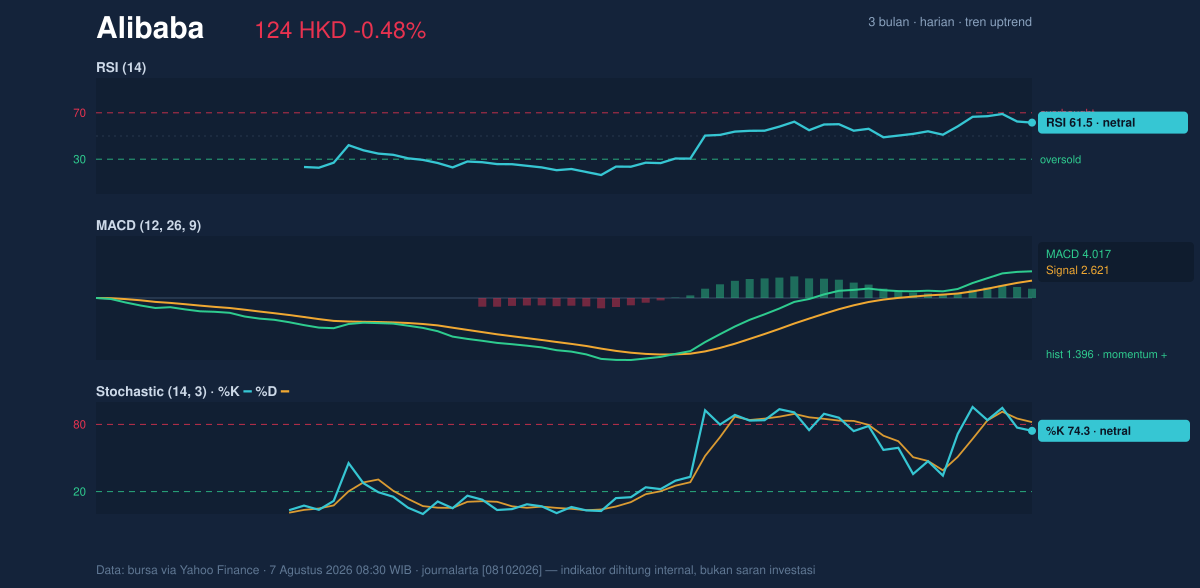
The signal set is therefore mixed in a useful way: the trend is up, the momentum is positive, but the oscillators are not screaming overbought. That usually leaves room for either consolidation or another attempt higher, rather than an immediate reversal.
Volatility & Volume
Volatility is not low. The ATR(14) at 4.89, equal to 3.9% of price, says daily swings remain relatively wide, so moves through support or resistance can happen quickly once they start. The Bollinger Band width at 19.4% is described as normal, which suggests the stock is not in a squeeze that often precedes a sudden expansion. In other words, the market is already moving, but not in a compressed setup that would strongly favor an imminent volatility burst.
Volume is the main caution flag. The latest turnover of 58,259,425 was only 0.6× the 20-session average of 104,020,754, so the recent price action came with noticeably less participation than usual. That matters because breakouts built on thin volume are easier to fade. Still, OBV is rising, which means the broader balance of volume has continued to support the uptrend even if the latest session was quiet. The message from volume is not bearish; it is simply incomplete. Price is advancing, but the market has not yet shown the kind of heavy confirmation that would make the next leg feel fully committed.
Key Levels & Scenarios
The nearest technical map is straightforward. HK$128.10 is the first resistance to watch, sitting just above the upper Bollinger Band at HK$127.77. A clean move through that area would tell traders that the stock is not just hovering near the top of its range but is trying to convert resistance into support. On the downside, HK$110.00 is the key support from the 20-session range, and it sits close to the rising moving-average structure, making it the first meaningful line where buyers would be expected to defend the trend.
The wider 3-month range provides context: the stock has traded between HK$144.00 and HK$88.65. That tells readers the current level is well above the lower end of the recent range, but still below the prior peak, so the market is operating in the middle-to-upper zone of a larger recovery rather than at a full breakout high.
Technical Verdict: HOLD (wait & see)
HOLD (wait & see) is the clearest technical reading because the trend is positive, but the latest move has not yet been confirmed by strong volume, and price is already pressing into nearby resistance.
Reasons:
- Golden cross and price above SMA20 and SMA50 confirm the trend remains upward.
- MACD positive with a positive histogram shows momentum is still supporting the move.
- Volume at 0.6× average suggests the latest push is not yet backed by broad participation.
Verdict invalidated if price breaks below HK$110.00, because that would weaken the current support structure and challenge the uptrend.
- Ideal Entry Range: HK$110.00 to HK$116.47
- Exit Target: HK$127.77 to HK$128.10
- Stop Loss Protection: below HK$110.00, with the lower Bollinger Band at HK$105.17 as the deeper risk marker
For non-traders: the chart still points upward, but the recent rise is not yet proven by strong trading volume.
Summary Data Alibaba
| Last price | 123.80 HKD |
| Change 1 day / 5 days / 1 month | -0.48% / 5.81% / 12.34% |
| Trend / MA-cross | uptrend / golden |
| SMA20 / SMA50 | 116.47 / 111.42 |
| RSI (14) / Stochastic %K | 61.5 / 74.3 |
| Bollinger %B / ATR | 82% / 4.89 |
| Support / Resistance 20 days | 110.00 / 128.10 |
| Data as of | 7 Agustus 2026 08:30 WIB |

